Fig. 6
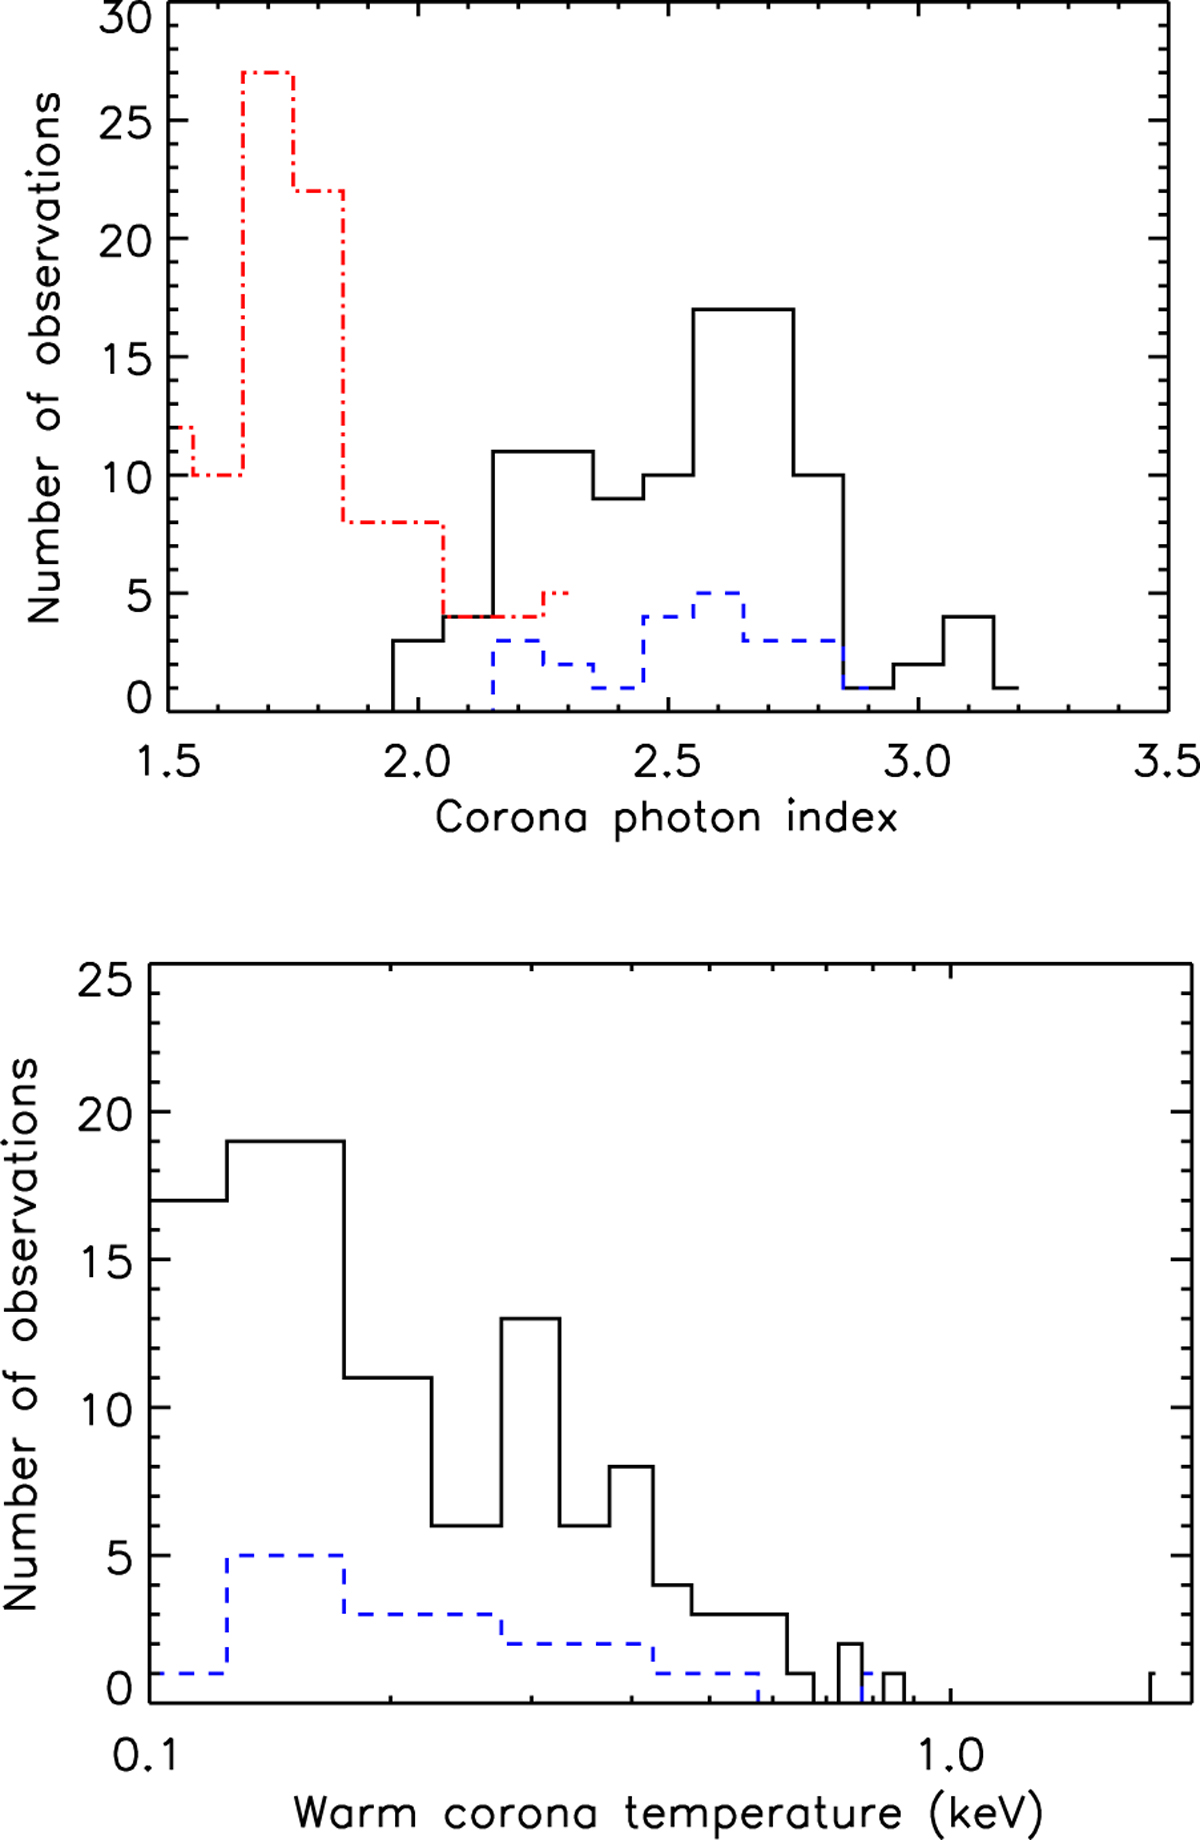
Warm corona photon index Γwc (top) and temperature kTwc (bottom) of the warm corona model for the different objects in our sample. The black solid histograms correspond to the whole observations. The dashed (blue) histogram corresponds to the average values of Γwc and kTwc for each object. In the top figure, we have also overplotted the histogram of the hot corona photon index Γhc (dot-dashed red line).
Current usage metrics show cumulative count of Article Views (full-text article views including HTML views, PDF and ePub downloads, according to the available data) and Abstracts Views on Vision4Press platform.
Data correspond to usage on the plateform after 2015. The current usage metrics is available 48-96 hours after online publication and is updated daily on week days.
Initial download of the metrics may take a while.