Fig. 5
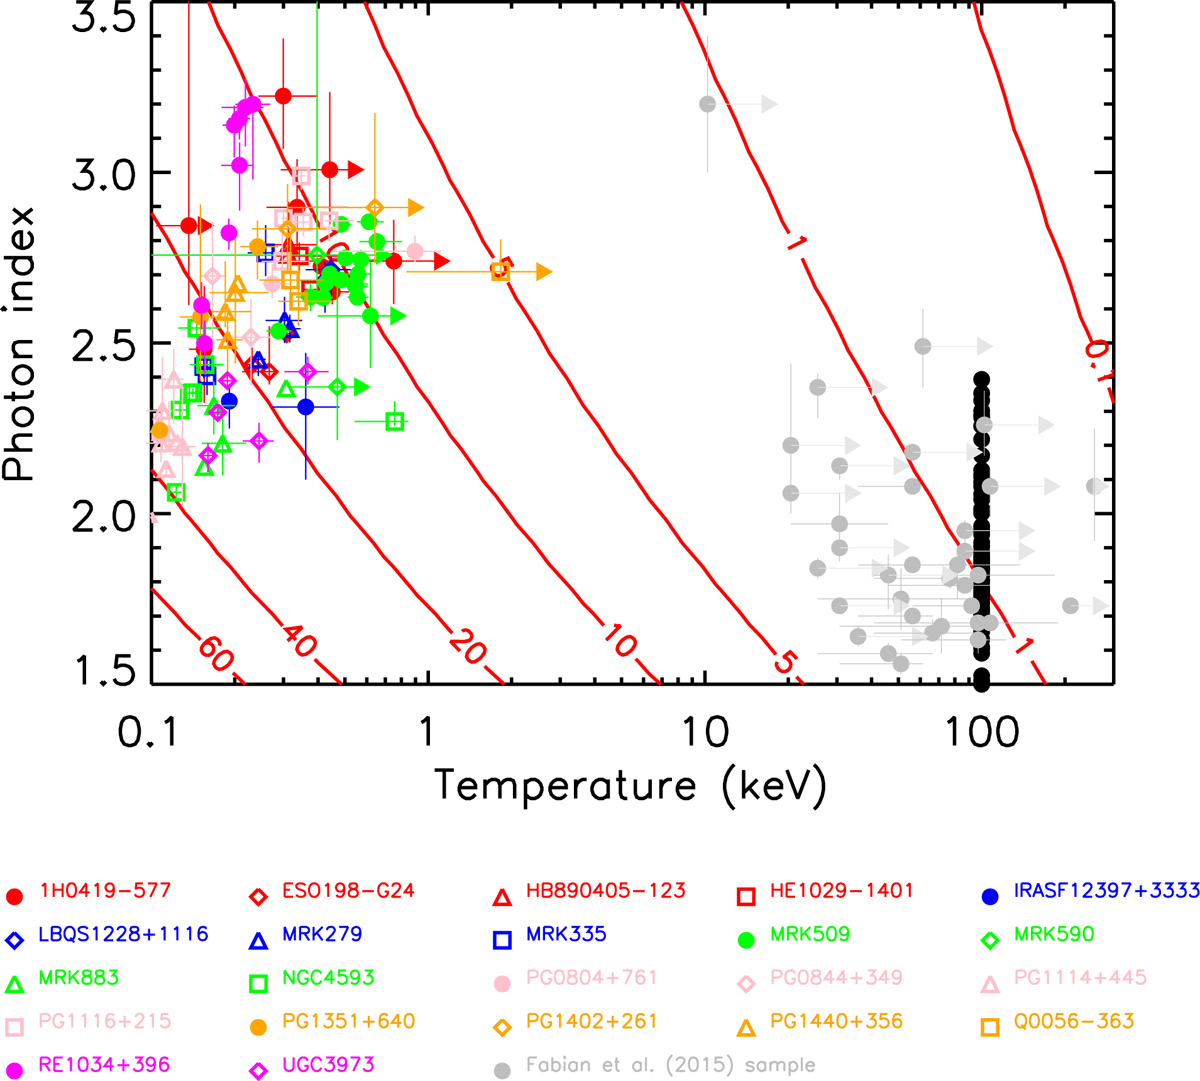
Best fit temperature and photon index of the warm corona of the different objects of our sample. Different colored symbols are used for each object. They cluster in the left part of the figure, and agree with large ( >5) optical depths. For comparison, we have also reported the best fit photon indexes of the hot corona (black circles on the right). The temperature of the hot corona being fixed to 100 keV in the fits, they are all aligned vertically. The gray filled circles correspond to the best fit parameters of the hot corona from Fabian et al. (2015). The hot corona parameters cluster in the bottom right part of the figure where the optical depth is close to unity.
Current usage metrics show cumulative count of Article Views (full-text article views including HTML views, PDF and ePub downloads, according to the available data) and Abstracts Views on Vision4Press platform.
Data correspond to usage on the plateform after 2015. The current usage metrics is available 48-96 hours after online publication and is updated daily on week days.
Initial download of the metrics may take a while.