Fig. 4
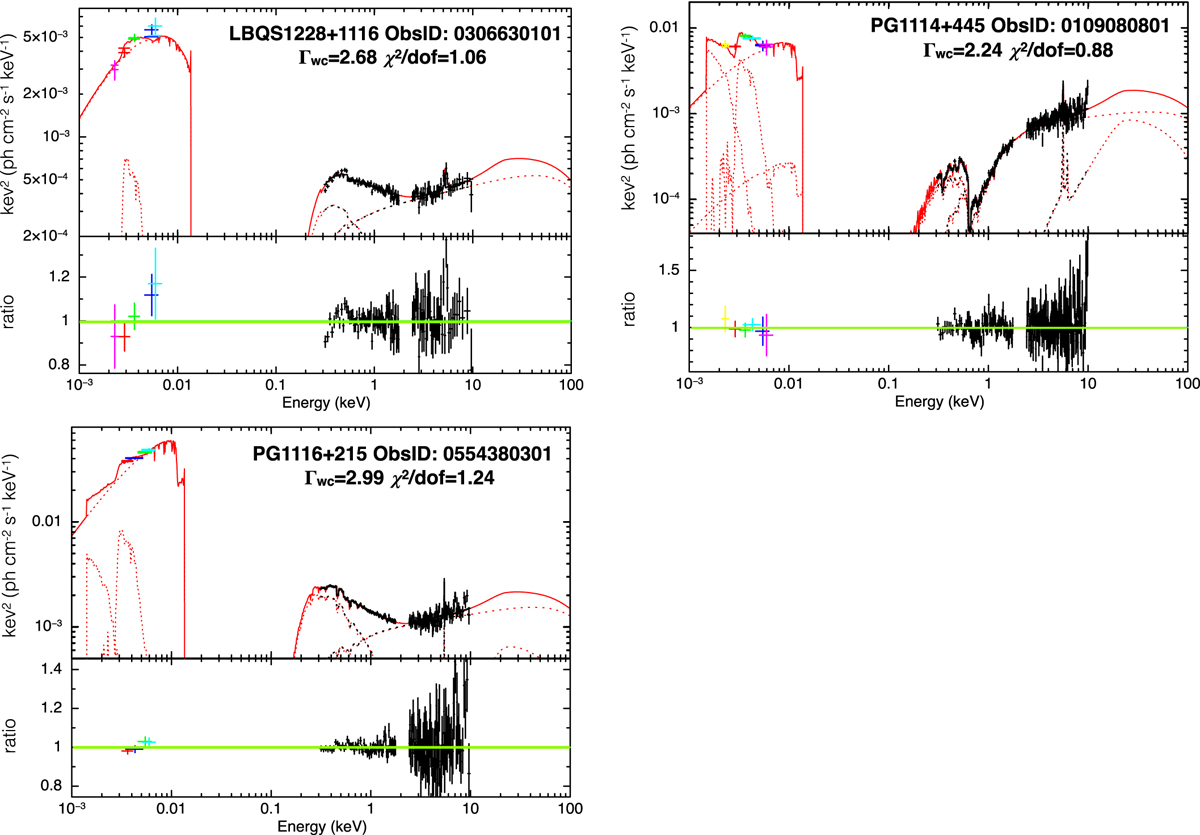
Examples of best fit SED and the data/model ratio for three observations with different warm corona photon indexes covering the range observed in our sample. The source names, ObsID, Γwc , and reduced χ2 are indicated in each plot. The black crosses represent the XMM/PN data and the colored crosses the different XMM/OM filters. The red solid line is the absorbed best fit model, while the dotted lines represent the different model components: hot and warm corona emission, reflection component, host galaxy, and small blue bump emission.
Current usage metrics show cumulative count of Article Views (full-text article views including HTML views, PDF and ePub downloads, according to the available data) and Abstracts Views on Vision4Press platform.
Data correspond to usage on the plateform after 2015. The current usage metrics is available 48-96 hours after online publication and is updated daily on week days.
Initial download of the metrics may take a while.