Free Access
Fig. 2
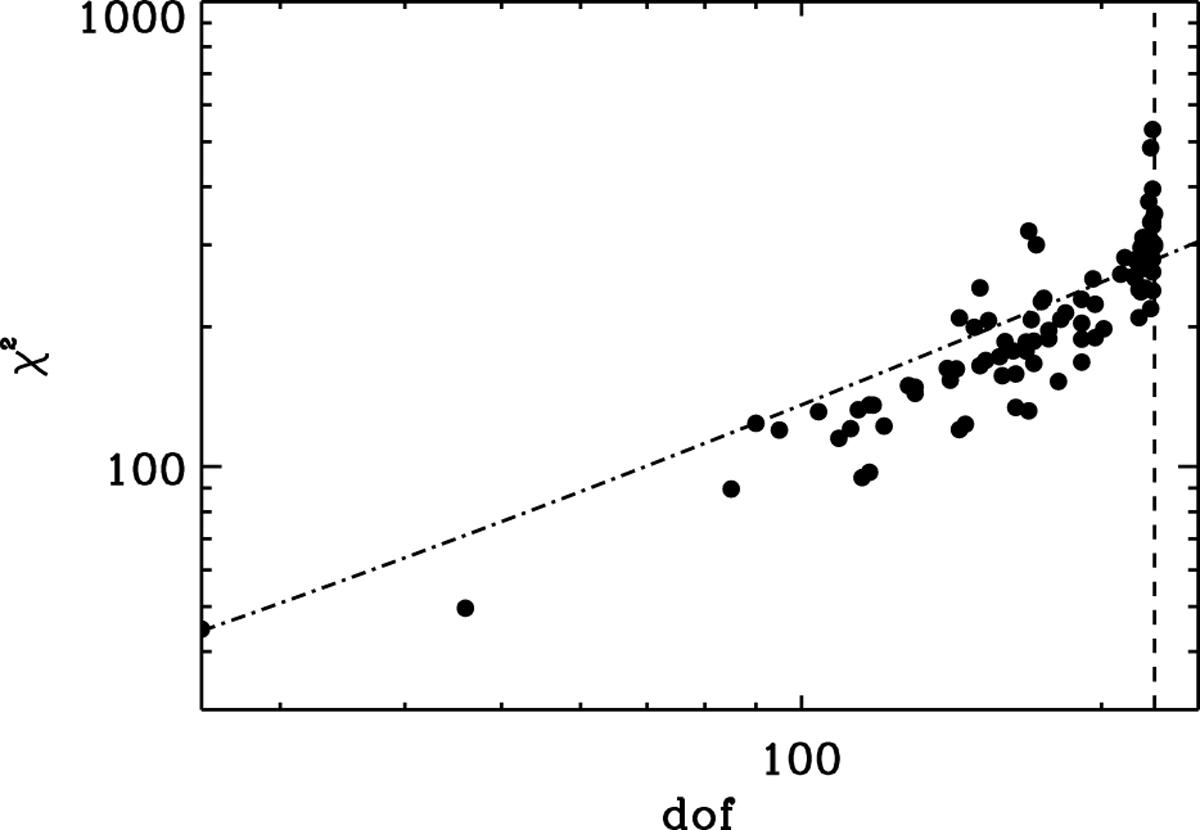
Distribution of our best fit χ2 in function of the degree of freedom (dof) of each observation of our sample. The dot-dashed curve indicates the χ2 value corresponding to a 99% null hypothesis probability for the corresponding dof value. The vertical dashed line represents the 226 dof limit of our sample.
Current usage metrics show cumulative count of Article Views (full-text article views including HTML views, PDF and ePub downloads, according to the available data) and Abstracts Views on Vision4Press platform.
Data correspond to usage on the plateform after 2015. The current usage metrics is available 48-96 hours after online publication and is updated daily on week days.
Initial download of the metrics may take a while.