Fig. 1
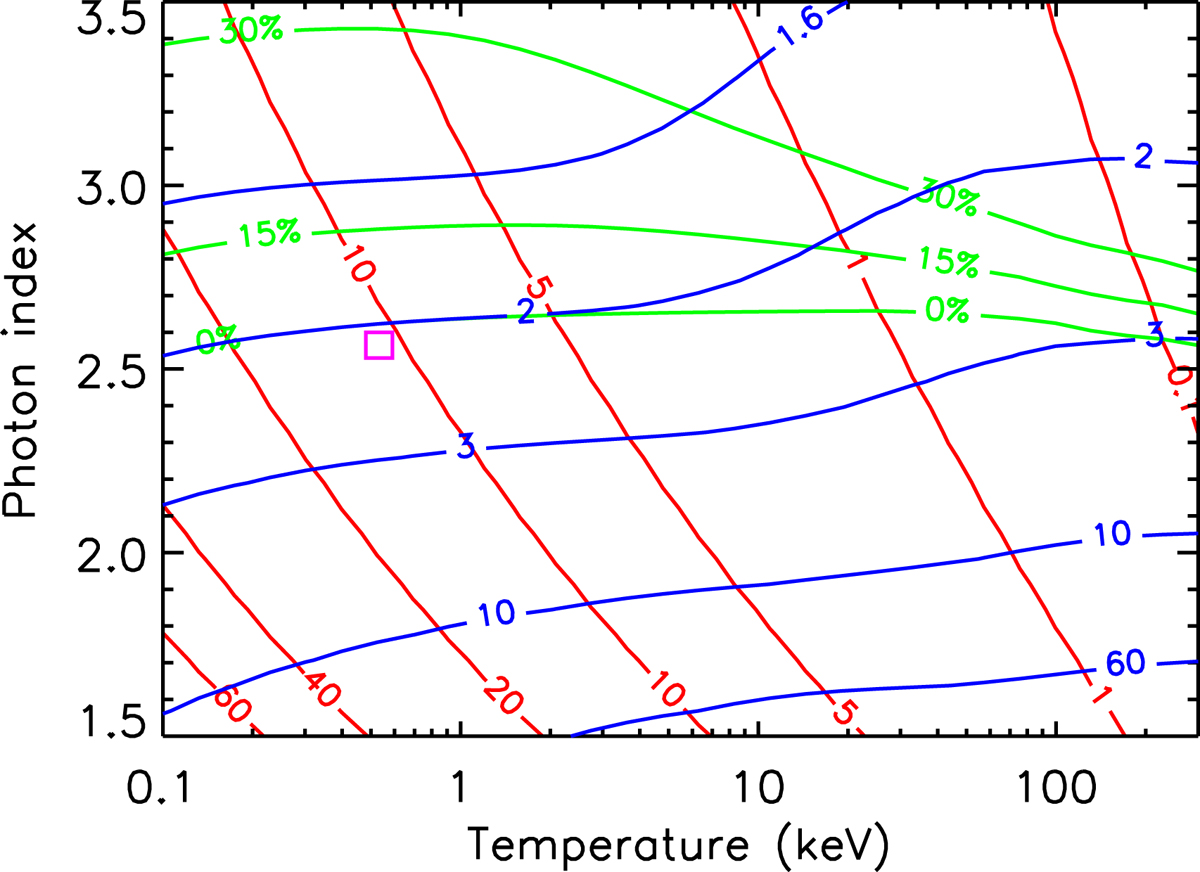
Contours of the corona optical depth τ
(in red), the amplification factor A
(in blue) andthe minimal fraction (in %) of disk intrinsic emission ![]() (in green) in the corona spectral parameter Γ-kT
plane. A slab geometry (i.e., g = 1
in Eq. (21)) is assumed here. Smaller values of g
(i.e., a patchy corona) would move the green contours down. The magenta rectangle corresponds to the
Γ
and temperature kTe
ranges obtained by P13 for the soft excess in the spectral analysis of the Mkn 509 campaign.
(in green) in the corona spectral parameter Γ-kT
plane. A slab geometry (i.e., g = 1
in Eq. (21)) is assumed here. Smaller values of g
(i.e., a patchy corona) would move the green contours down. The magenta rectangle corresponds to the
Γ
and temperature kTe
ranges obtained by P13 for the soft excess in the spectral analysis of the Mkn 509 campaign.
Current usage metrics show cumulative count of Article Views (full-text article views including HTML views, PDF and ePub downloads, according to the available data) and Abstracts Views on Vision4Press platform.
Data correspond to usage on the plateform after 2015. The current usage metrics is available 48-96 hours after online publication and is updated daily on week days.
Initial download of the metrics may take a while.