Free Access
Fig. 3
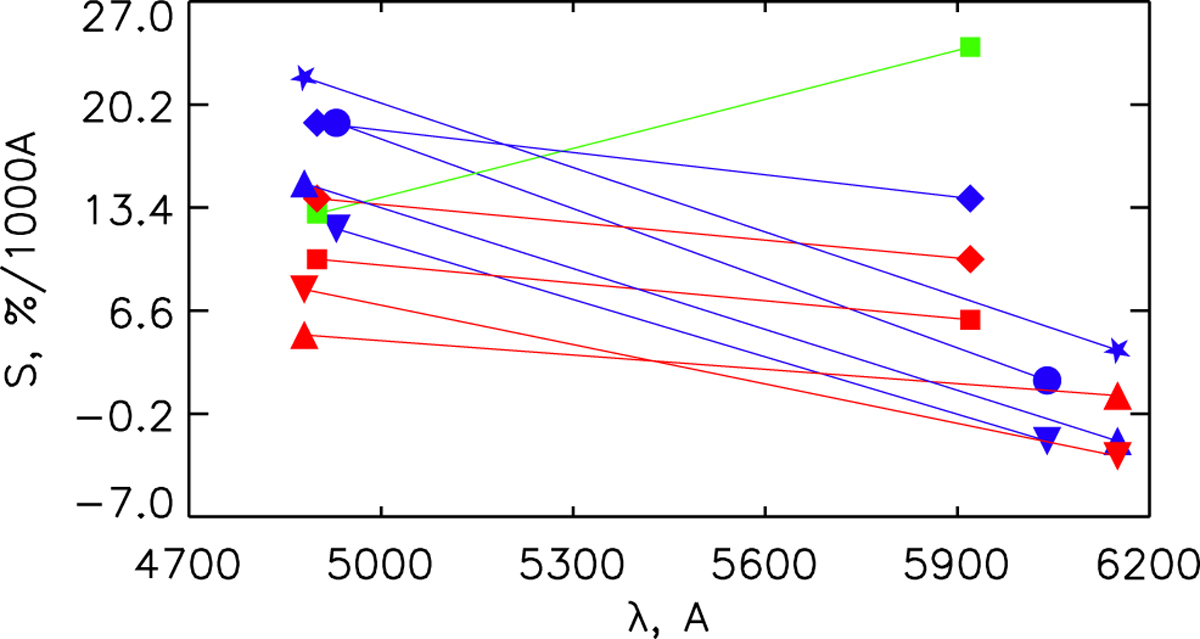
Normalized reflectivity gradients of the selected NICs in the BV and VR spectral regions. Blue and red symbols indicate data points for the comets observed before and after perihelia, respectively; the target with a different spectral behavior is indicated in green.
Current usage metrics show cumulative count of Article Views (full-text article views including HTML views, PDF and ePub downloads, according to the available data) and Abstracts Views on Vision4Press platform.
Data correspond to usage on the plateform after 2015. The current usage metrics is available 48-96 hours after online publication and is updated daily on week days.
Initial download of the metrics may take a while.