Fig. 1
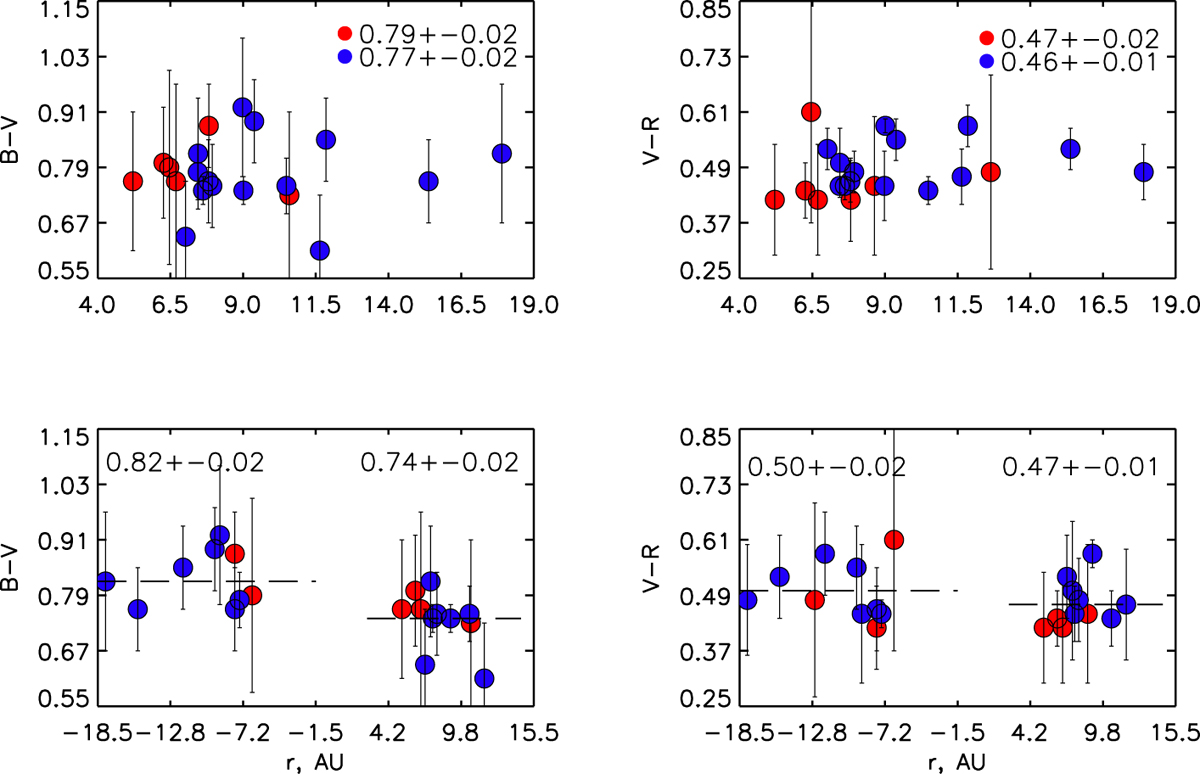
Color indices of the dynamically new comets against their heliocentric distances. Red circles indicate the comets from this study and blue circles denote the dynamically new comets selected from Jewitt (2015). Top Panel: all data points; the mean values calculated for each of subsamples separately are inserted in the figure. Bottom Panel: pre- and post-perihelion observations separately assuming that the two subsamples (“red” and “blue”) belong to the same selection. Error bars of 3σ are shown.
Current usage metrics show cumulative count of Article Views (full-text article views including HTML views, PDF and ePub downloads, according to the available data) and Abstracts Views on Vision4Press platform.
Data correspond to usage on the plateform after 2015. The current usage metrics is available 48-96 hours after online publication and is updated daily on week days.
Initial download of the metrics may take a while.