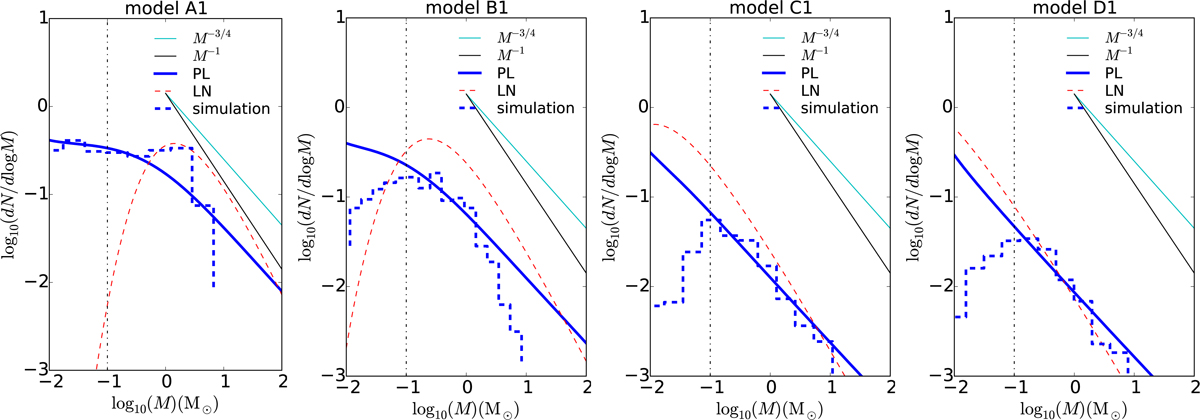
Fig. 8

Mass spectra as predicted from analytical model for four sets of parameters corresponding to runs A1++, B1++, C1+, and D1. Simulation results at 150 M⊙ accreted (blue dashed, same as the magenta histogram in Fig. 6 with absolute value shifted to compare to models), model with power-law (blue solid) and lognormal (red dashed) density PDF are plotted, as well as the power-law relation (–3/4 in cyan and –1 in black) for reference. The vertical dot-dashed line indicates a mass lower limit above whichthe model is applicable (see paper II).
Current usage metrics show cumulative count of Article Views (full-text article views including HTML views, PDF and ePub downloads, according to the available data) and Abstracts Views on Vision4Press platform.
Data correspond to usage on the plateform after 2015. The current usage metrics is available 48-96 hours after online publication and is updated daily on week days.
Initial download of the metrics may take a while.


