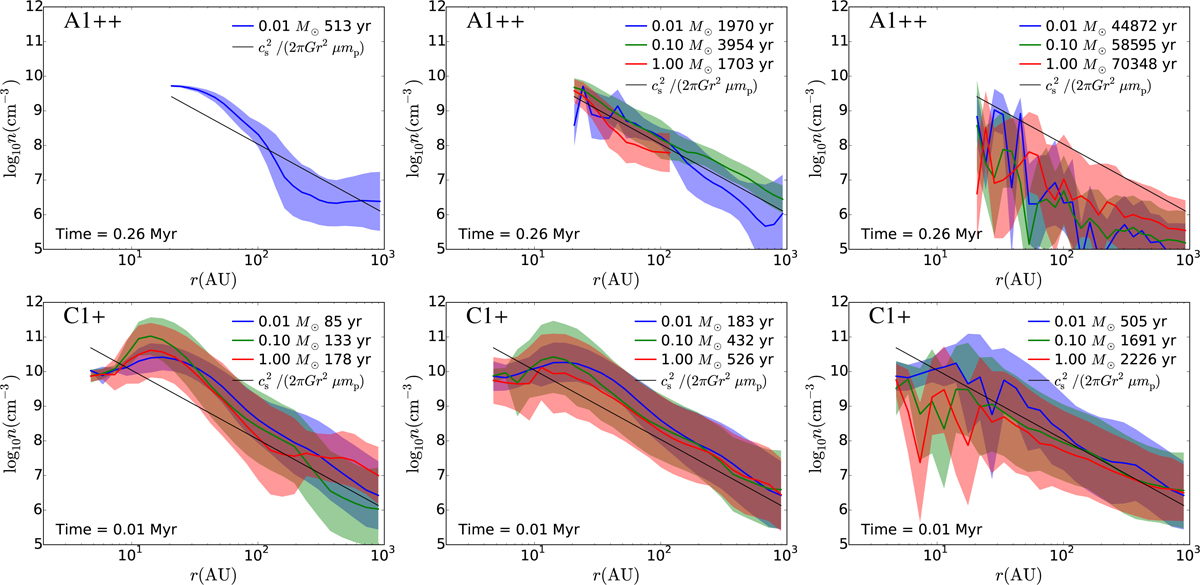
Fig. 4

Density profiles around sink particles for runs A1++ at 0.26 Myr (top panels) and C1+ at 0.008 Myr (bottom
panels). From left to right, sinks aged under 1000 yr, 5000 yr, or all sinks are used to produce the average profiles for
run A1++, while 300 yr and 1000 yr are used as thresholds for run C1+. Sink particles are separated into three mass bins
<0.01 M⊙
(blue), 0.01–0.1 M⊙
(green), and 0.1–1 M⊙
(red), average age of selected sinks is shown in the legend. Shaded regions represent the standard
deviation of the density profiles for all sinks and all radial directions. The SIS density profile,
![]() ,
is plotted in black for reference. The density profile at younger ages is always broadly
∝ r−2 ,
with a factor~10
higher than the SIS, while sinks of older ages have probably accreted all mass from
the core in which it is embedded or have been ejected, thus decorrelating from the
r−2
profile. Thisis reflected by the large dispersion that is particularly evident with more massive sinks.
,
is plotted in black for reference. The density profile at younger ages is always broadly
∝ r−2 ,
with a factor~10
higher than the SIS, while sinks of older ages have probably accreted all mass from
the core in which it is embedded or have been ejected, thus decorrelating from the
r−2
profile. Thisis reflected by the large dispersion that is particularly evident with more massive sinks.
Current usage metrics show cumulative count of Article Views (full-text article views including HTML views, PDF and ePub downloads, according to the available data) and Abstracts Views on Vision4Press platform.
Data correspond to usage on the plateform after 2015. The current usage metrics is available 48-96 hours after online publication and is updated daily on week days.
Initial download of the metrics may take a while.


