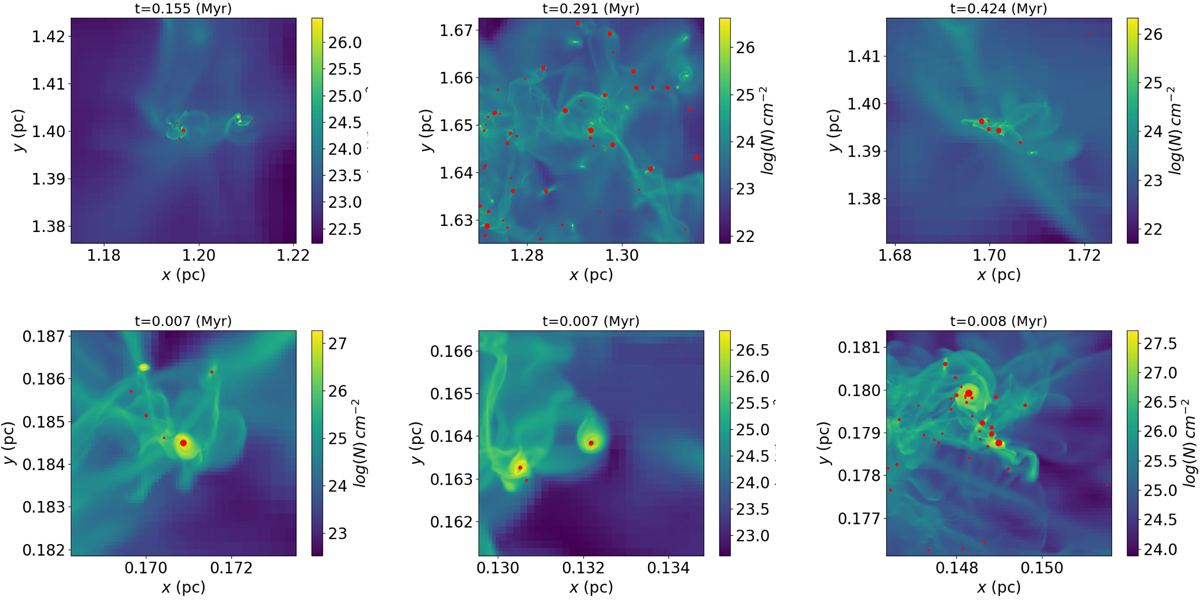
Fig. 2

Zoomed column density maps of runs A1++ (top row) and C1+ (bottom row). Red dots represent the sink particles, and their sizes correspond to the sink mass. Disk formation around sink particles is observed in both cases, while the disks in run A1++ are more extended, showing likely signs of rotation and fragmentation, and the disks in run C1+ are significantly smaller, with no sign of fragmentation.
Current usage metrics show cumulative count of Article Views (full-text article views including HTML views, PDF and ePub downloads, according to the available data) and Abstracts Views on Vision4Press platform.
Data correspond to usage on the plateform after 2015. The current usage metrics is available 48-96 hours after online publication and is updated daily on week days.
Initial download of the metrics may take a while.


