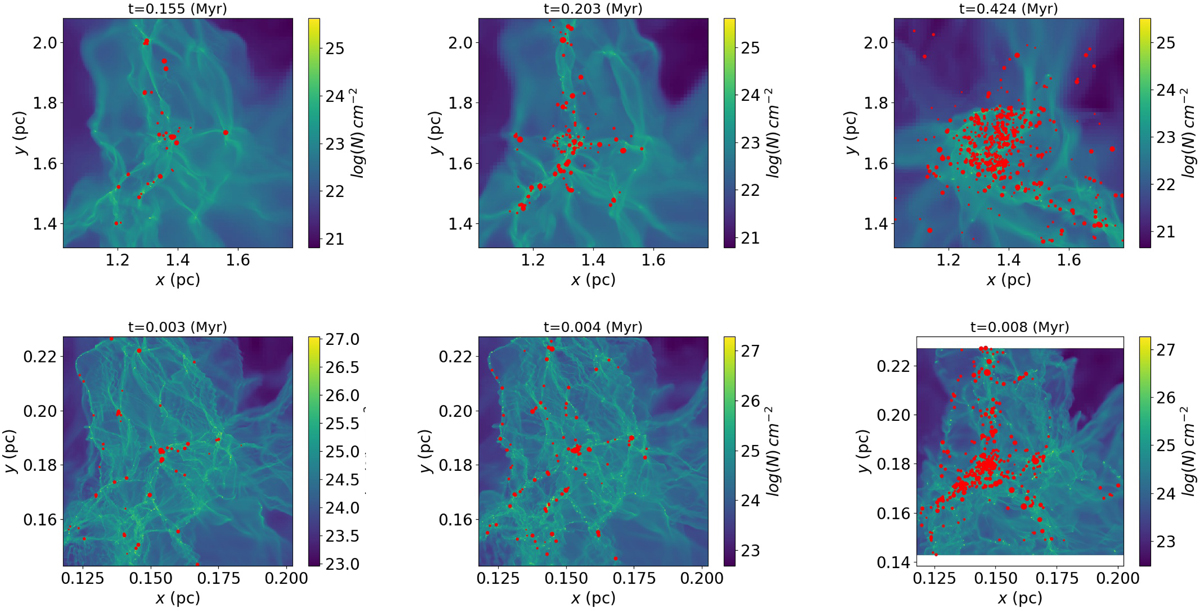
Fig. 1

Column density maps of runs A1++ at 0.155, 0.203, 0.424 Myr (top row from left to right) and C1+ at 0.003, 0.004, 0.008 Myr (bottom row from left to right). Run A1++ is more globally collapsing, and the sinks, initially forming inside the filamentary network, are more concentrated in a central cluster. Run C1+ is initially much denser and the evolution of the filamentary structure is more pronounced, with more widespread sink formation.
Current usage metrics show cumulative count of Article Views (full-text article views including HTML views, PDF and ePub downloads, according to the available data) and Abstracts Views on Vision4Press platform.
Data correspond to usage on the plateform after 2015. The current usage metrics is available 48-96 hours after online publication and is updated daily on week days.
Initial download of the metrics may take a while.


