Fig. 6
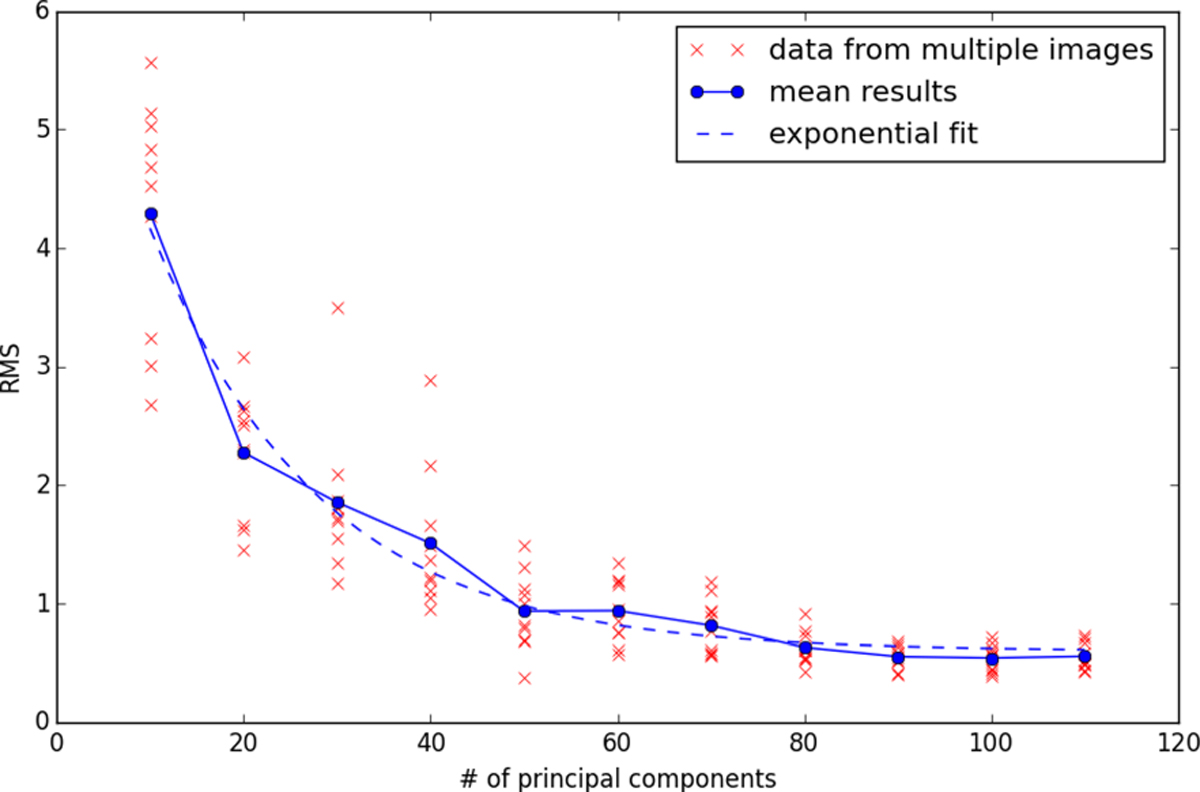
Convergence of the computed residual background when moreprincipal components are used for the fit. The data points in the plot are the square root of the mean quadratic sum (RMS) of the difference between two background images with different number of components. The points at X principal components were calculated by taking the background image fitted with X components minus the background image fitted with X + 10 components and taking the RMS (calculated over the whole image) from this difference. There are 10 different results for each # of components because this was done for 10 randomly selected star images. The continuous line goes through the mean values of theresults to show how the background converges. The e-folding scale from the exponential fit to the curve is 18 components.
Current usage metrics show cumulative count of Article Views (full-text article views including HTML views, PDF and ePub downloads, according to the available data) and Abstracts Views on Vision4Press platform.
Data correspond to usage on the plateform after 2015. The current usage metrics is available 48-96 hours after online publication and is updated daily on week days.
Initial download of the metrics may take a while.