Fig. 3
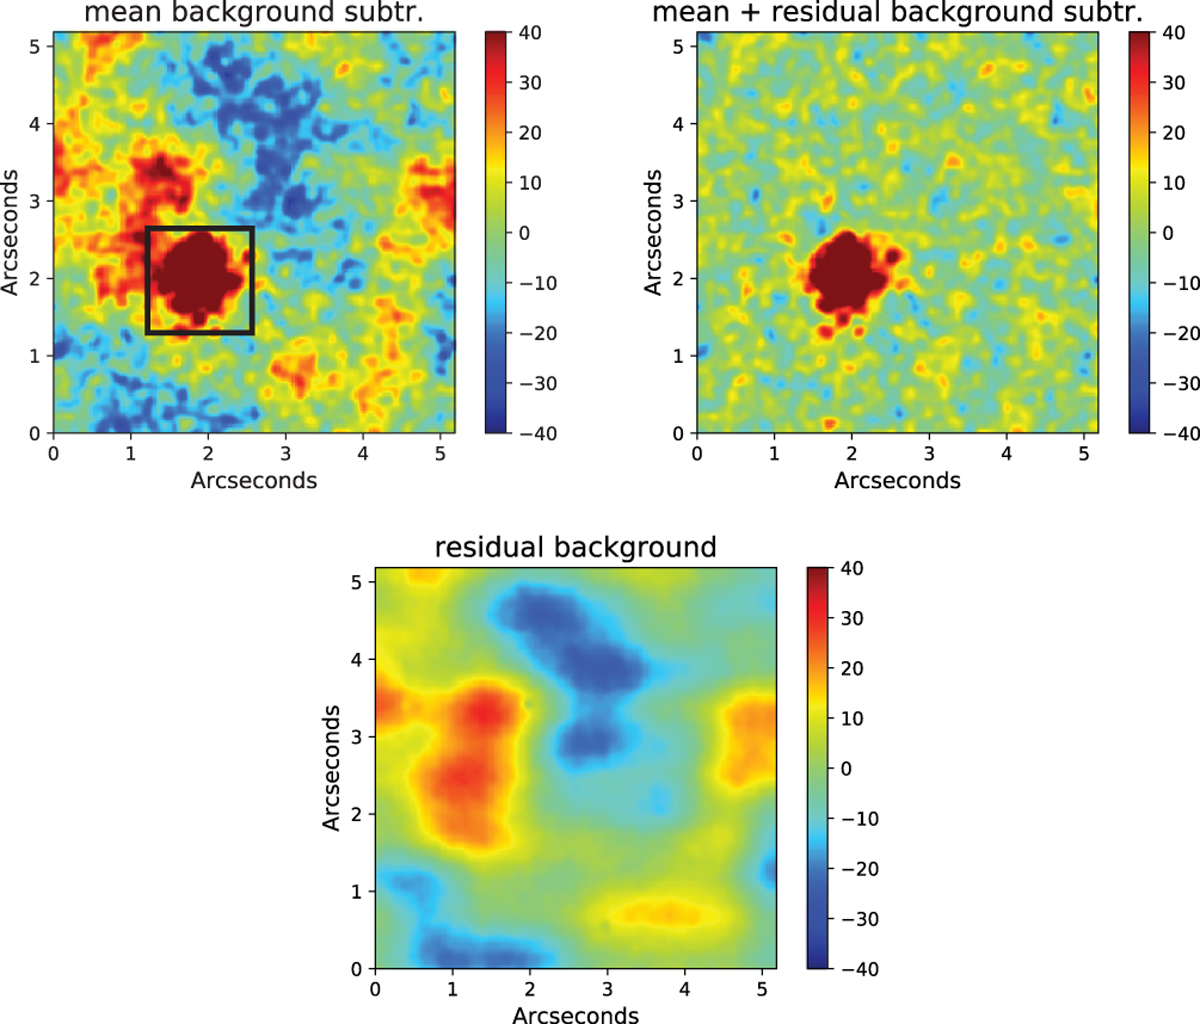
Comparison between a star image with subtracted mean background (upper left) and subtracted mean and PCA residual background with 60 principal components (upper right). The star image also shows the area around the stellar PSF which is masked for the fit of the principal components (black rectangle). The image on the bottom shows the corresponding PCA residual background. All images were smoothed with a Gaussian filter to improve the visibility of the background structure.
Current usage metrics show cumulative count of Article Views (full-text article views including HTML views, PDF and ePub downloads, according to the available data) and Abstracts Views on Vision4Press platform.
Data correspond to usage on the plateform after 2015. The current usage metrics is available 48-96 hours after online publication and is updated daily on week days.
Initial download of the metrics may take a while.