Fig. 3
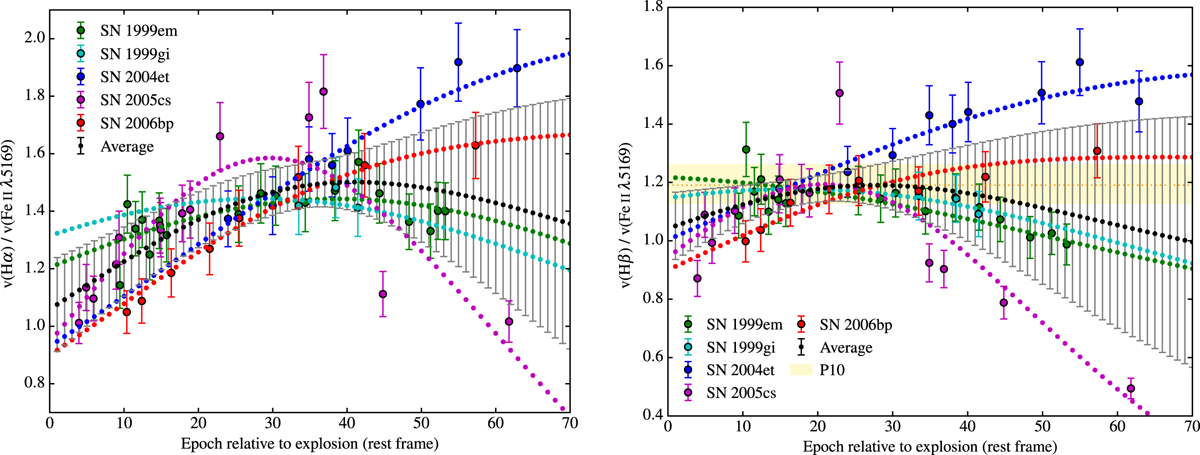
vHα/vFe 5169 ratio (left panel) and vHβ/vFe 5169 ratio (right panel) compared to the rest frame epoch (from explosion). The thick dotted lines represent the vH α /vFe 5169 and vH β/vFe 5169 ratios for the individual SNe as well as the averaged ratios. For reasons of better visibility the uncertainty is depicted only for the averaged ratios and not for the fitted velocity ratios of the individual SN. Thecircle markers represent the measured vH α /vFe 5169 and vH β/vFe 5169 ratios for those epochs and SNe where spectroscopic data was available and both Hα (or Hβ) and the Fe ii λ5169 velocity could be measured. The yellow shaded band in the right panel corresponds to the ratio of vH β /vFe 5169 = 1.19![]() as given by Poznanski et al. (2010).
as given by Poznanski et al. (2010).
Current usage metrics show cumulative count of Article Views (full-text article views including HTML views, PDF and ePub downloads, according to the available data) and Abstracts Views on Vision4Press platform.
Data correspond to usage on the plateform after 2015. The current usage metrics is available 48-96 hours after online publication and is updated daily on week days.
Initial download of the metrics may take a while.