Fig. A.9
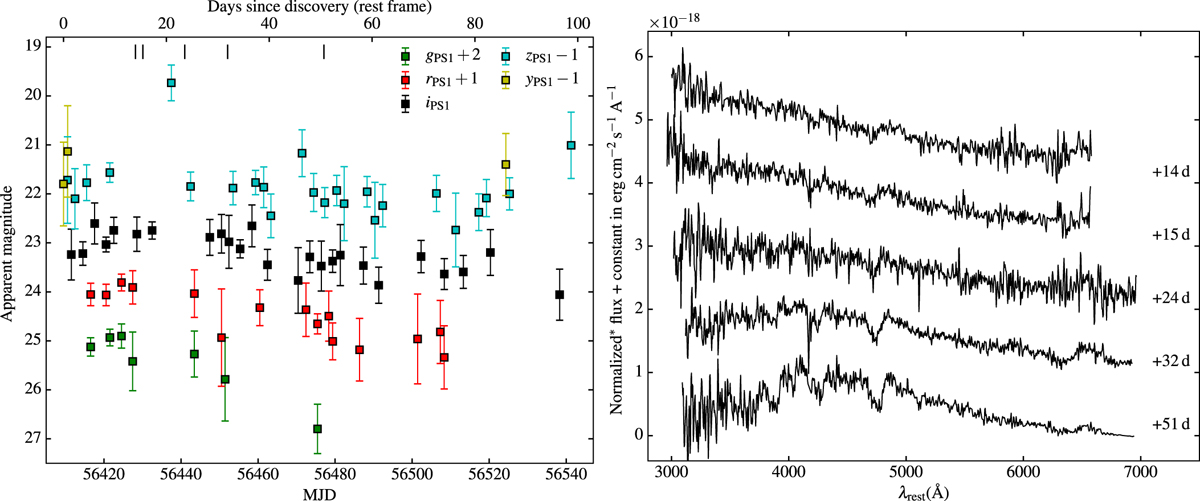
PS1-13bni. Left panel: grizyPS1 light curves of PS1-13bni. The vertical ticks on the top mark the epochs of the observed spectra. Right panel: PS1-13bni spectroscopy. (*) Flux normalized to the maximum Hα flux for better visibility of the features. The exact normalizations are: flux/2.5 for the +14 d spectrum; flux/2.5 for +15 d; flux/2.5 for +24 d; flux/2.2 for +32 d; flux/2.1 for +51 d.
Current usage metrics show cumulative count of Article Views (full-text article views including HTML views, PDF and ePub downloads, according to the available data) and Abstracts Views on Vision4Press platform.
Data correspond to usage on the plateform after 2015. The current usage metrics is available 48-96 hours after online publication and is updated daily on week days.
Initial download of the metrics may take a while.