Fig. 7
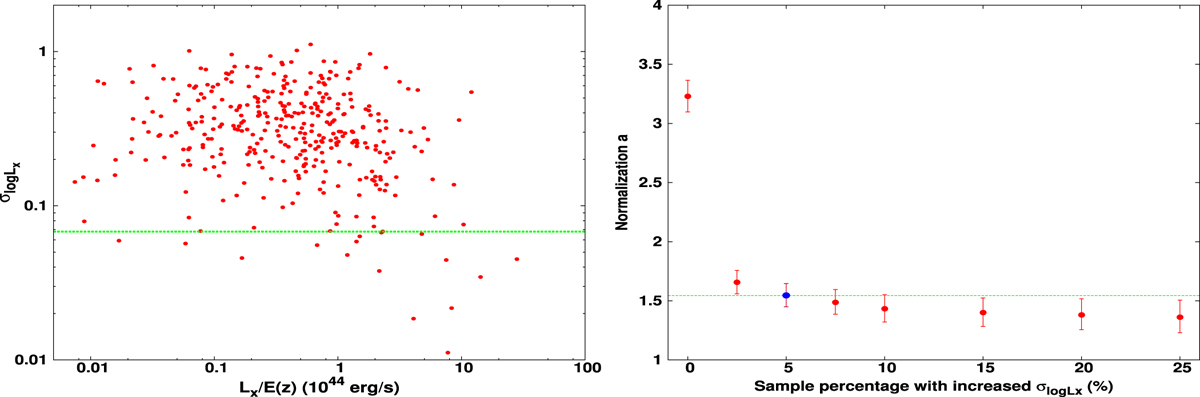
Left panel: logarithmic luminosity uncertainty ![]() as a functionof the X-ray bolometric luminosity LX,
together with the correction limit
as a functionof the X-ray bolometric luminosity LX,
together with the correction limit ![]() (green line). Right panel: the best-fit normalization value for the entire sample (with the
slope fixed to its best-fit value) as a function of the sample percentage in which an extra
LX
uncertainty is added. The blue point and the green line represent the sample percentage that we use and the best-fit
value we derive.
(green line). Right panel: the best-fit normalization value for the entire sample (with the
slope fixed to its best-fit value) as a function of the sample percentage in which an extra
LX
uncertainty is added. The blue point and the green line represent the sample percentage that we use and the best-fit
value we derive.
Current usage metrics show cumulative count of Article Views (full-text article views including HTML views, PDF and ePub downloads, according to the available data) and Abstracts Views on Vision4Press platform.
Data correspond to usage on the plateform after 2015. The current usage metrics is available 48-96 hours after online publication and is updated daily on week days.
Initial download of the metrics may take a while.