Free Access
Fig. 5
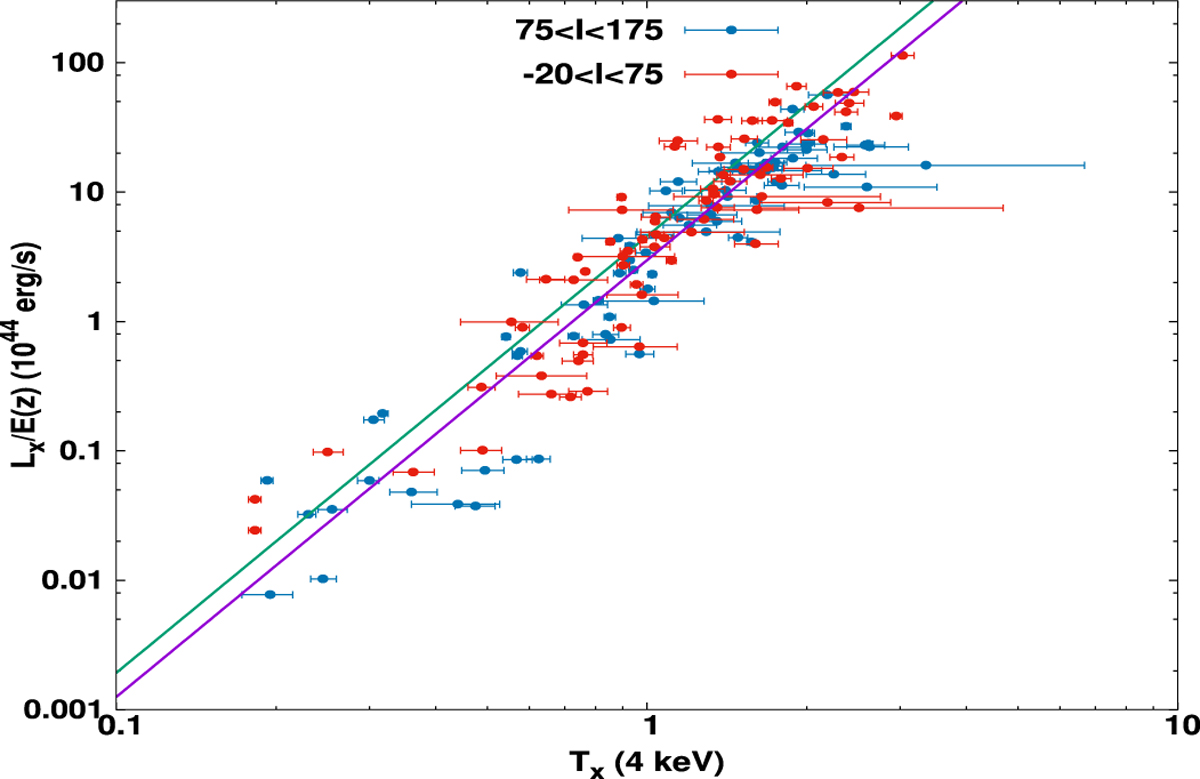
Bolometric luminosity LX as a functionof temperature T for the sky regions within l ∈ (−20°, 75°) (Group A, red) and l ∈ (75°, 175°) (Group C, blue). The best-fit functions (with a fixed slope of b = 3.375) are also displayed with green for Group A (a = 4.563) and with purple for Group C (a = 2.963).
Current usage metrics show cumulative count of Article Views (full-text article views including HTML views, PDF and ePub downloads, according to the available data) and Abstracts Views on Vision4Press platform.
Data correspond to usage on the plateform after 2015. The current usage metrics is available 48-96 hours after online publication and is updated daily on week days.
Initial download of the metrics may take a while.