Fig. 4
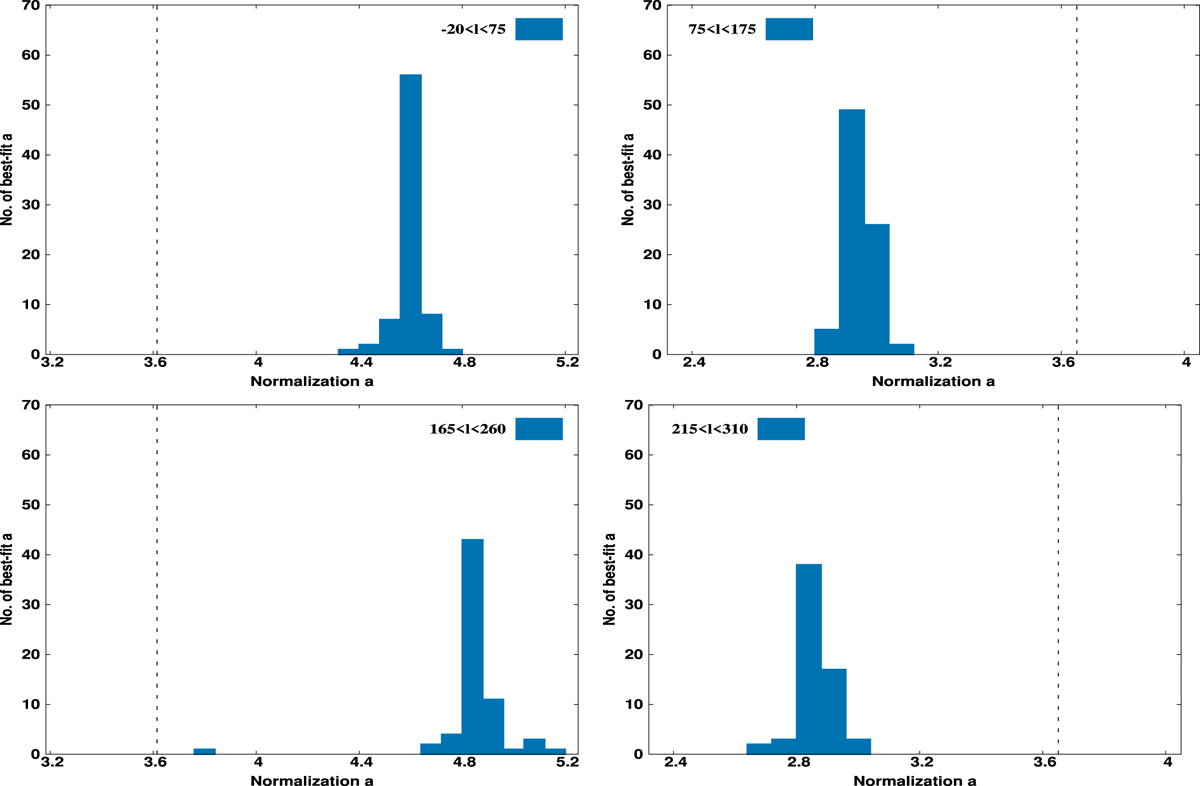
Distribution of the best-fit value of the normalization as obtained by the Jackknife resampling method, for the sky regions with 75 clusters within l ∈ (−20°, 75°) (top left), 82 clusters within l ∈ (75°, 175°) (top right), 66 clusters within l ∈ (165°, 260°) (bottom left)and 63 clusters within l ∈ (215°, 310°) (bottom right).
Current usage metrics show cumulative count of Article Views (full-text article views including HTML views, PDF and ePub downloads, according to the available data) and Abstracts Views on Vision4Press platform.
Data correspond to usage on the plateform after 2015. The current usage metrics is available 48-96 hours after online publication and is updated daily on week days.
Initial download of the metrics may take a while.