Free Access
Fig. 9
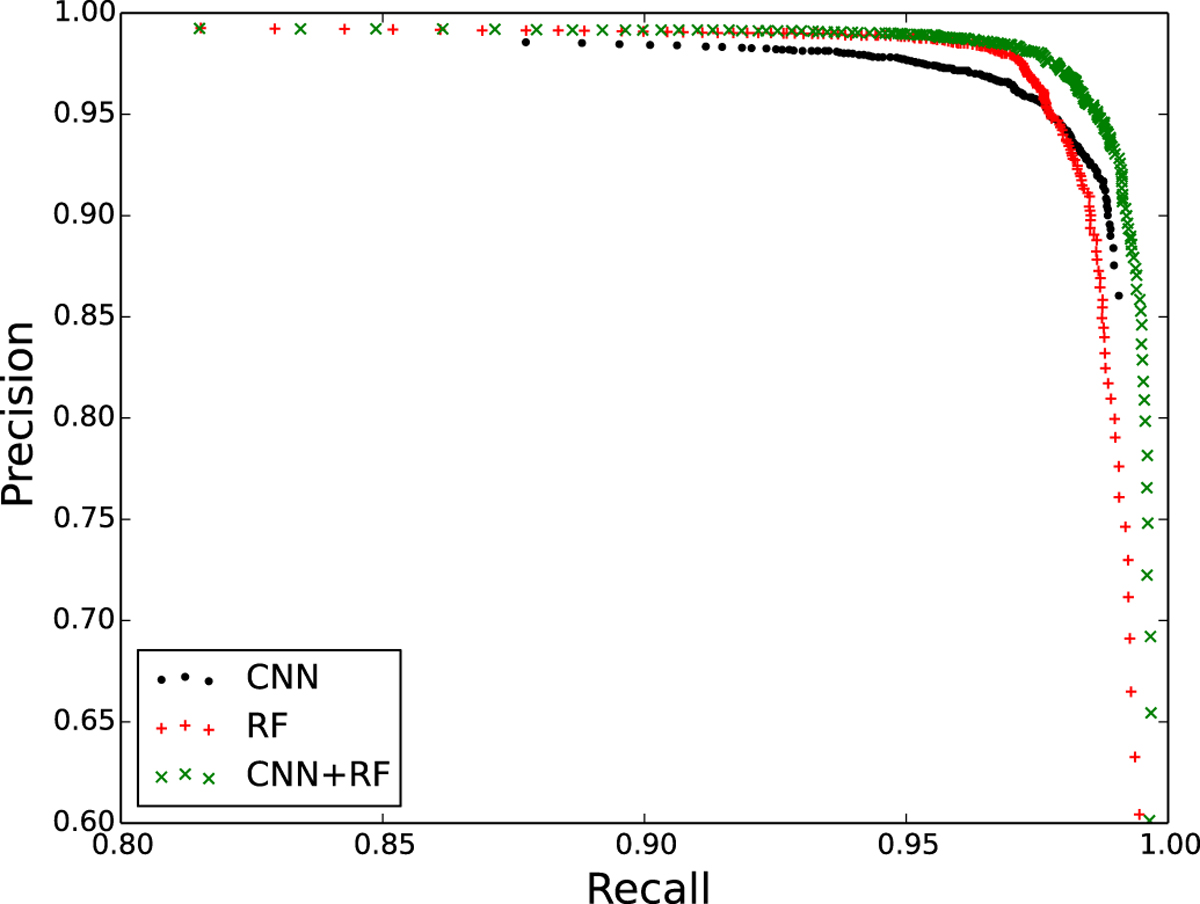
ROC curve which plots the precision of the classifier against the recall. The performance of the CNN classifier is represented by black dots, those of the random forest by red plus andthe performance of the combination of the two classifiers is represented by green crosses.
Current usage metrics show cumulative count of Article Views (full-text article views including HTML views, PDF and ePub downloads, according to the available data) and Abstracts Views on Vision4Press platform.
Data correspond to usage on the plateform after 2015. The current usage metrics is available 48-96 hours after online publication and is updated daily on week days.
Initial download of the metrics may take a while.