Fig. 8
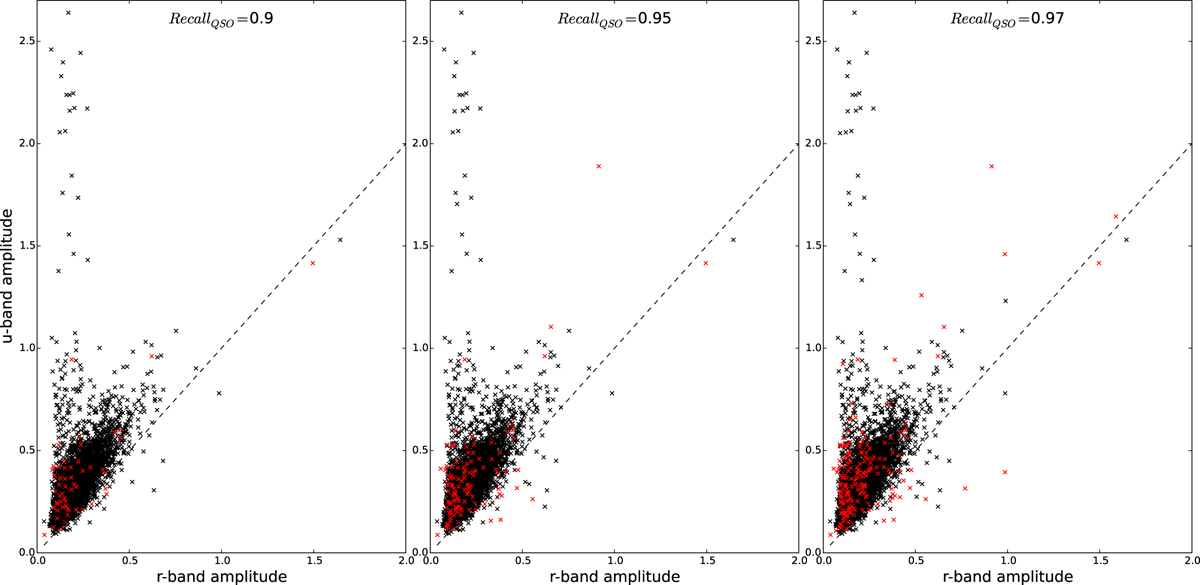
Amplitudes of variation of quasars detected by the CNN from the u-band filteragainst those from the r-band filter at three different recalls: 0.90, 0.95, and 0.97. The black crosses represent all the known quasars during the testing phase. The red crosses are the 175 new quasar candidates. The dashed lines represent the line y = x. The quasars show larger variation amplitudes in bluer-bands. This tendency highlights a strong wavelength dependence.
Current usage metrics show cumulative count of Article Views (full-text article views including HTML views, PDF and ePub downloads, according to the available data) and Abstracts Views on Vision4Press platform.
Data correspond to usage on the plateform after 2015. The current usage metrics is available 48-96 hours after online publication and is updated daily on week days.
Initial download of the metrics may take a while.