Fig. 5
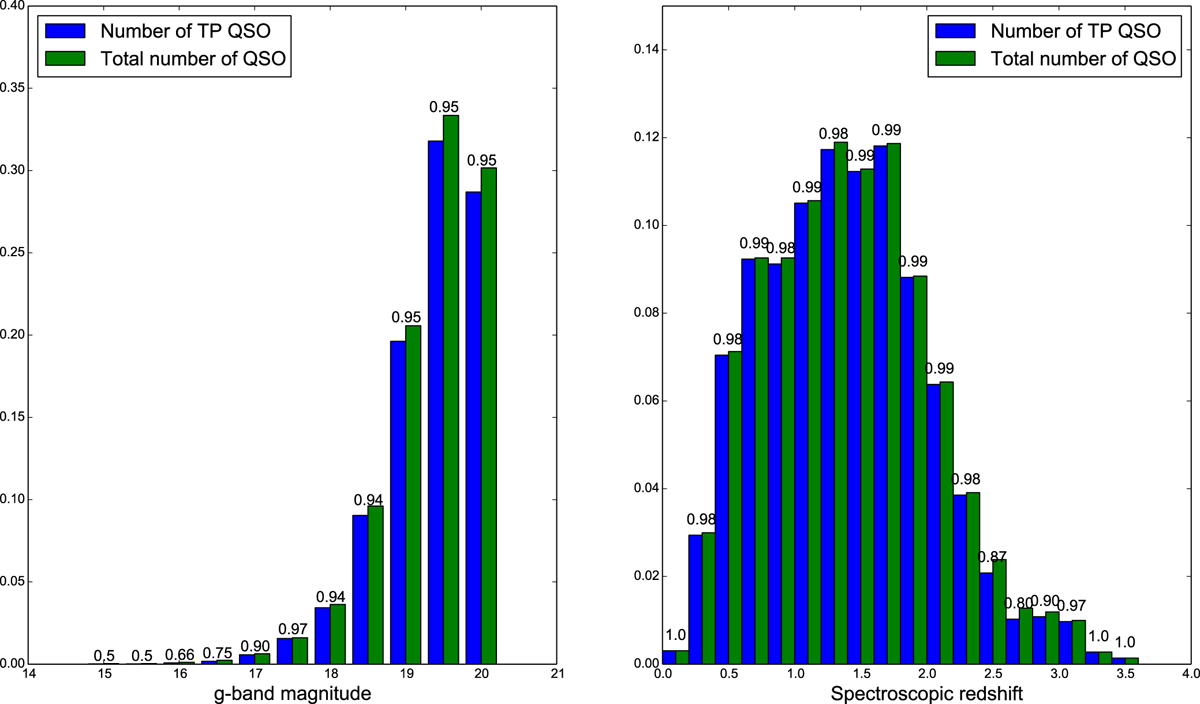
Left: performance of the CNN depending on the median g-band magnitude. Right: performance of the CNN in function of the redshift. On each histogram the blue bars represent the number of well detected quasars by the CNN and the green bars the total number of quasars inside the corresponding bin. The recall is indicated over each couple of bars.
Current usage metrics show cumulative count of Article Views (full-text article views including HTML views, PDF and ePub downloads, according to the available data) and Abstracts Views on Vision4Press platform.
Data correspond to usage on the plateform after 2015. The current usage metrics is available 48-96 hours after online publication and is updated daily on week days.
Initial download of the metrics may take a while.