Fig. 1
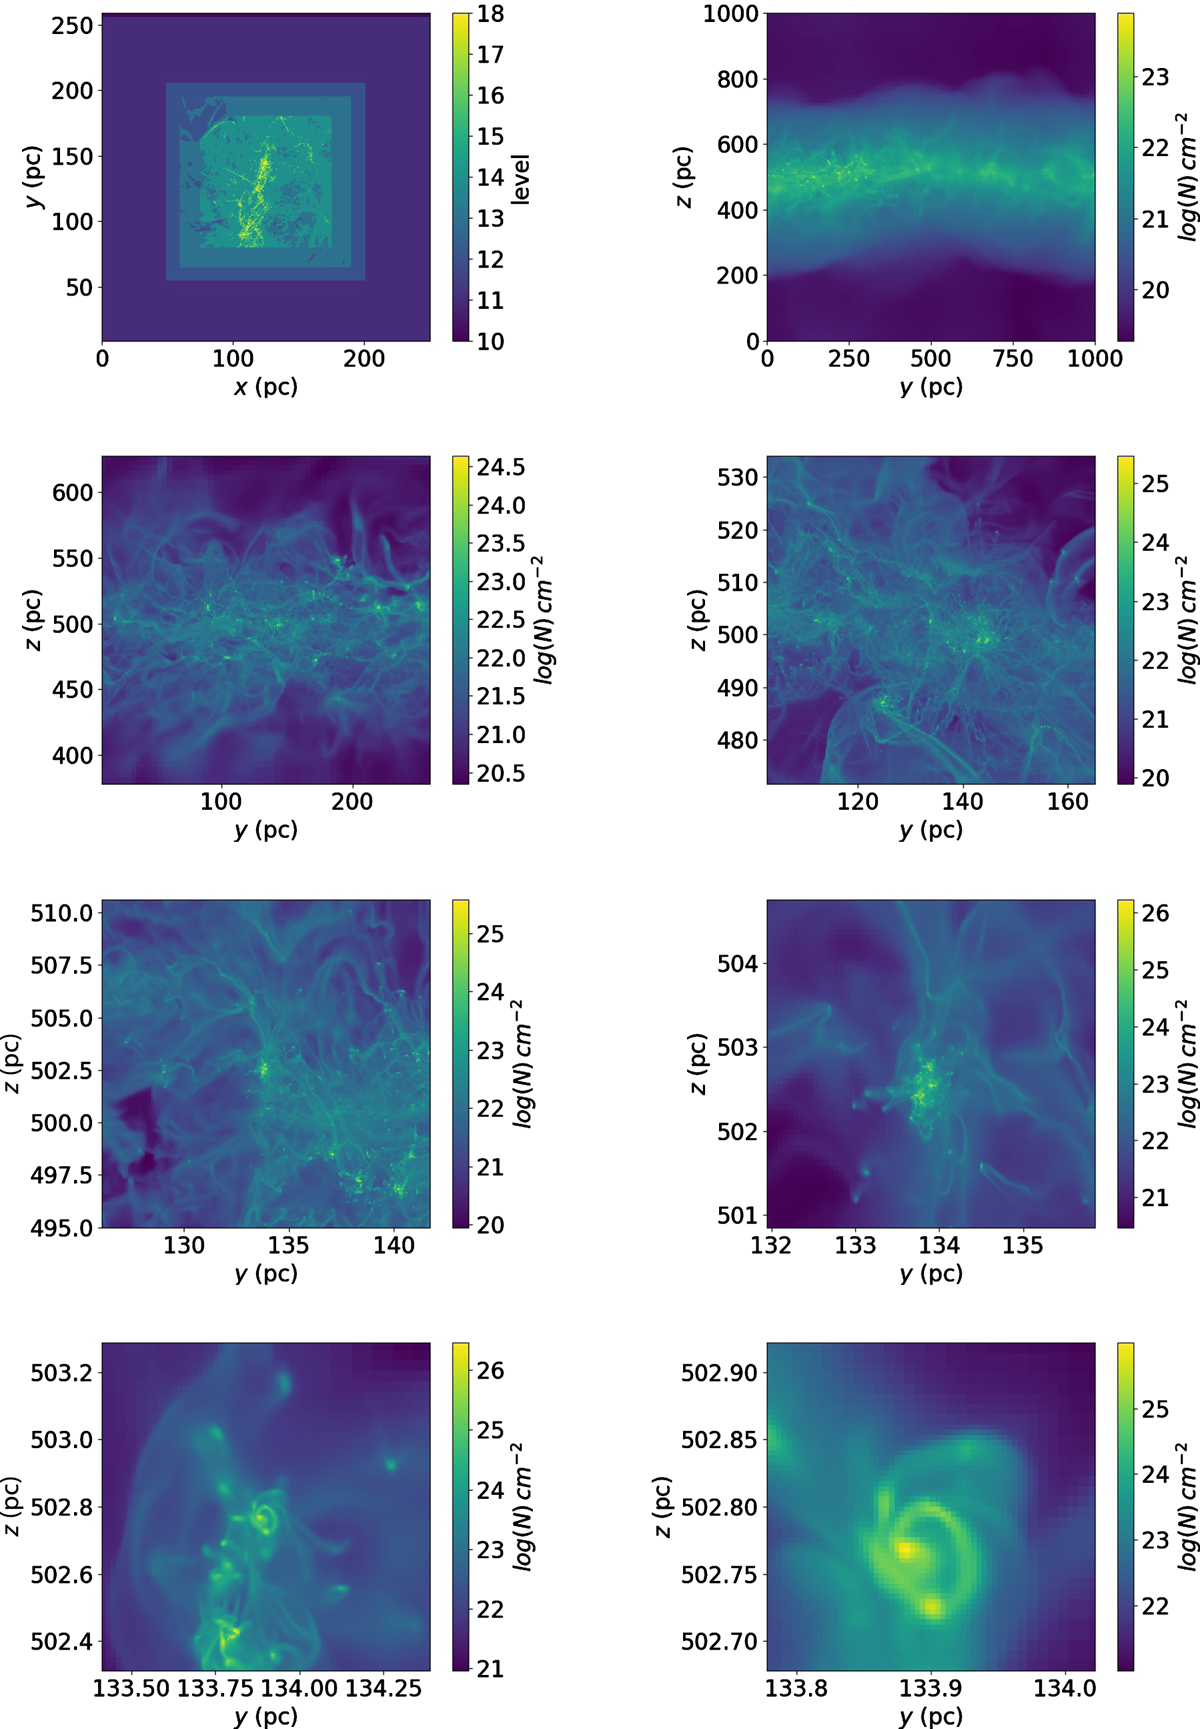
Top-left panel: AMR level used to perform the calculation in one quarter of the computing box. The zooming strategy is clearly visible. The first levels use nearly uniform refinement while the last ones are based on the Jeans length and follow the dense gas. Top-right panel: column density for the whole computing box and along the x-axis. Second, third and fourth rows display a series ofzooms, going from 250 to 0.25 pc, showingthe column density along the y-axis. From the bottom rows, the interest and limit of the calculation clearly appear. The cores as entities are reasonably described but their internal structure is poorly described.
Current usage metrics show cumulative count of Article Views (full-text article views including HTML views, PDF and ePub downloads, according to the available data) and Abstracts Views on Vision4Press platform.
Data correspond to usage on the plateform after 2015. The current usage metrics is available 48-96 hours after online publication and is updated daily on week days.
Initial download of the metrics may take a while.