Fig. 5
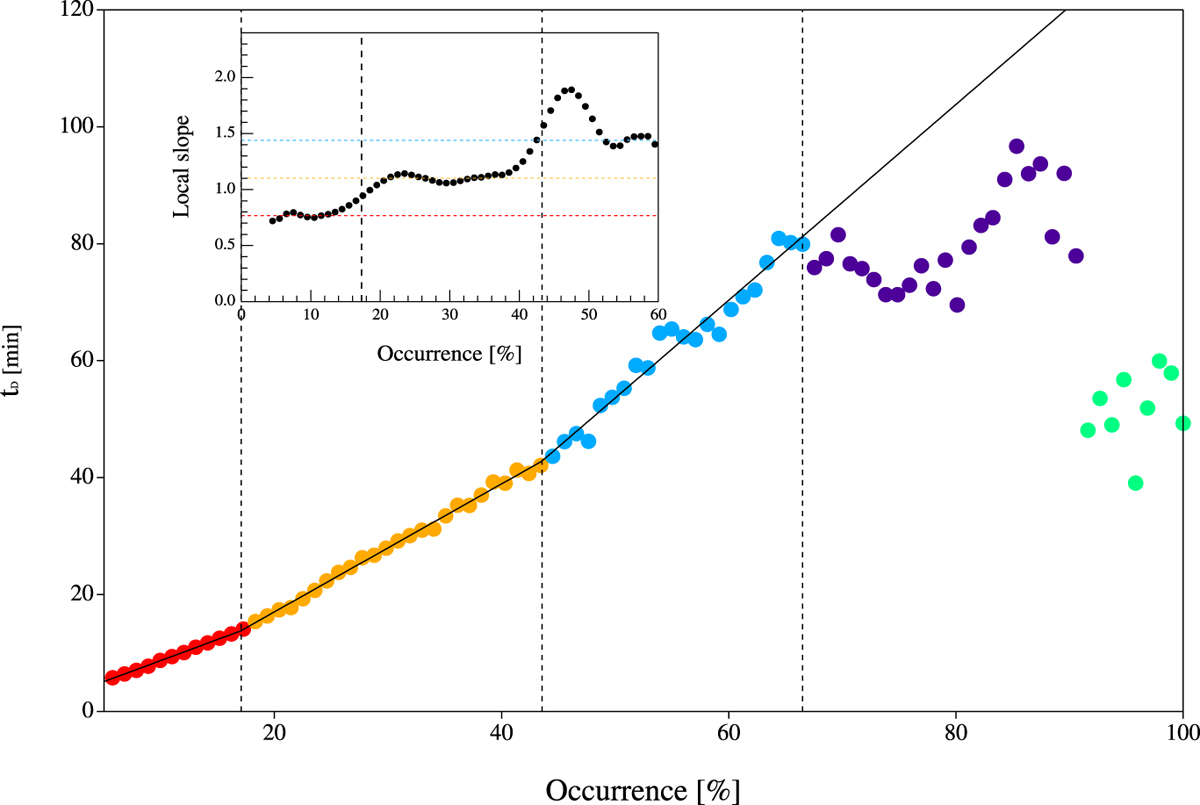
Scatter plot between occurrence (in percentage) and the average decorrelation time (in minute) in bins of occurrence ~ 1% wide (corresponding to 10 frames). The different colours and the vertical dashed lines separate different regimes in the plot. The solid line corresponds to the best fit of data from a polygonal model up to an occurrence of 65%. Top left inset: local slope of data points as a function of occurrence. The different regimes detected correspond to nearly constant slopes of 0.77 (in red), 1.10 (in orange), and 1.44 (in blue).
Current usage metrics show cumulative count of Article Views (full-text article views including HTML views, PDF and ePub downloads, according to the available data) and Abstracts Views on Vision4Press platform.
Data correspond to usage on the plateform after 2015. The current usage metrics is available 48-96 hours after online publication and is updated daily on week days.
Initial download of the metrics may take a while.