Fig. 6
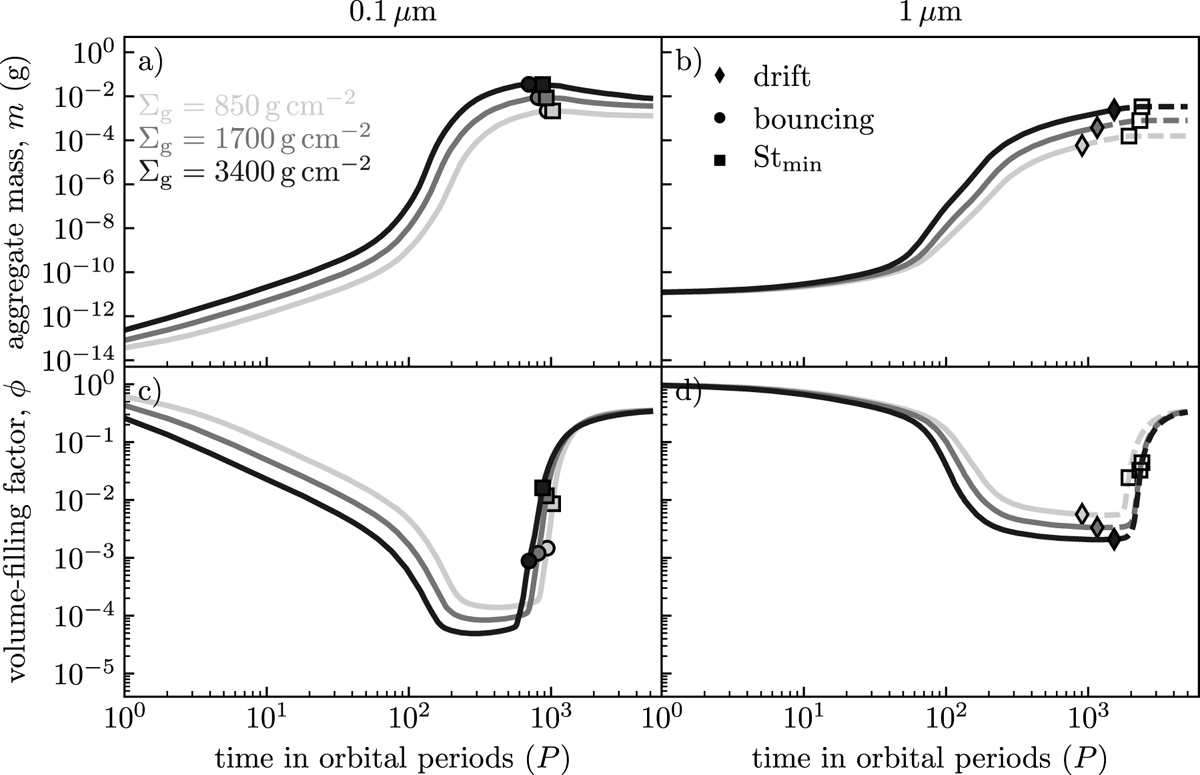
Aggregate mass and volume-filling factor vs time for different disk surface densities. The heliocentric distance is 30 au. Panels a and b: mass evolution for 0.1 μm and 1 μm sized monomers, while panels c and d: volume-filling factor evolution. The diamond and the circle indicate when the system becomes drift limited and bouncing dominated, respectively. A square indicates when the aggregates reach Stmin = 1.5 × 10⁻³ (Yang et al. 2017). To clearly indicate the case when the system becomes drift limited, the lines continue as dashed lines after this point. An increased gas surface density leads to higher aggregate masses, and vice versa.
Current usage metrics show cumulative count of Article Views (full-text article views including HTML views, PDF and ePub downloads, according to the available data) and Abstracts Views on Vision4Press platform.
Data correspond to usage on the plateform after 2015. The current usage metrics is available 48-96 hours after online publication and is updated daily on week days.
Initial download of the metrics may take a while.