Fig. 2
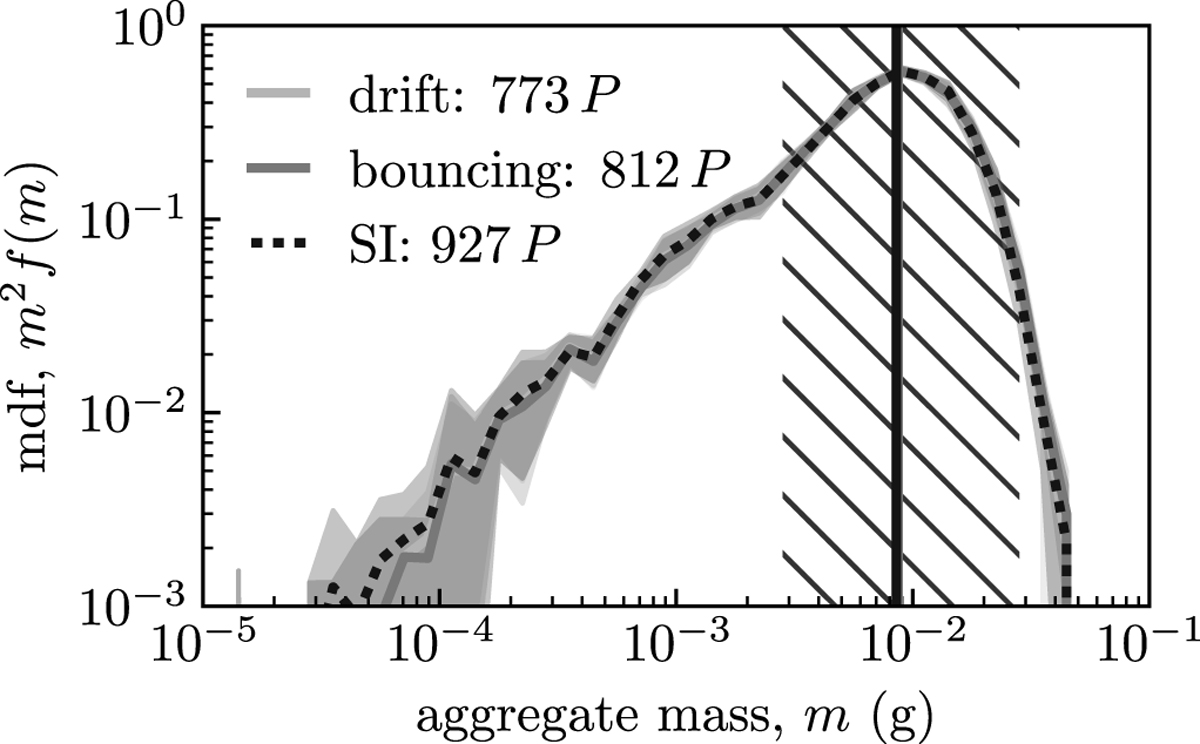
Mass distribution function for 0.1 μm monomers in the nominal case. Mass distribution functions at times when the system becomes drift limited (drift), bouncing dominated (bouncing), and when the aggregates reach Stmin (SI) are plotted. Numbers next to the labels show the times in orbital periods. Vertical lines mark the peak of the distribution function, and the hatched area highlights the region around the peak that contributes 95% to the peak. The mdf show that the system becomes bouncing dominated for 0.1 μm sized monomers. The peak between drift and bouncing changes by ≲ 2%, and the two mdf differ by ≲ 5% around the peak where most of the mass is contained. The larger uncertainties at the low-mass and high-mass ends of the mdf are due to the low resolution of the representative particle method in this part.
Current usage metrics show cumulative count of Article Views (full-text article views including HTML views, PDF and ePub downloads, according to the available data) and Abstracts Views on Vision4Press platform.
Data correspond to usage on the plateform after 2015. The current usage metrics is available 48-96 hours after online publication and is updated daily on week days.
Initial download of the metrics may take a while.