Fig. D.1
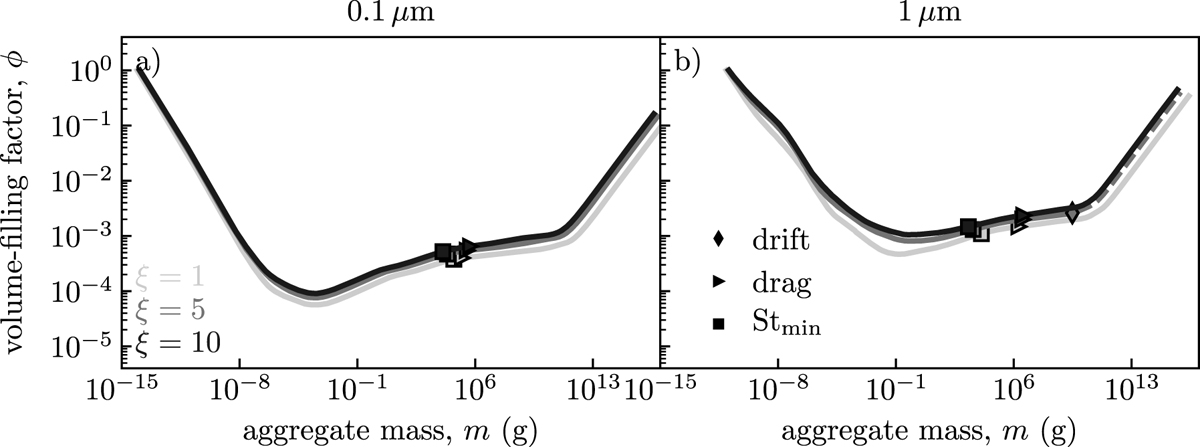
Volume-filling factor vs peak mass at heliocentric distance of 5 au. Monomer size is a) 0.1 μm, and b) 1 μm. A square indicates when the aggregates reach Stmin (Yang et al. 2017). A triangle pointing to the right denotes the change from the Epstein drag regime to the Stokes drag regime. We plot the results in the same way as Okuzumi et al. (2012).
Current usage metrics show cumulative count of Article Views (full-text article views including HTML views, PDF and ePub downloads, according to the available data) and Abstracts Views on Vision4Press platform.
Data correspond to usage on the plateform after 2015. The current usage metrics is available 48-96 hours after online publication and is updated daily on week days.
Initial download of the metrics may take a while.