Fig. 10
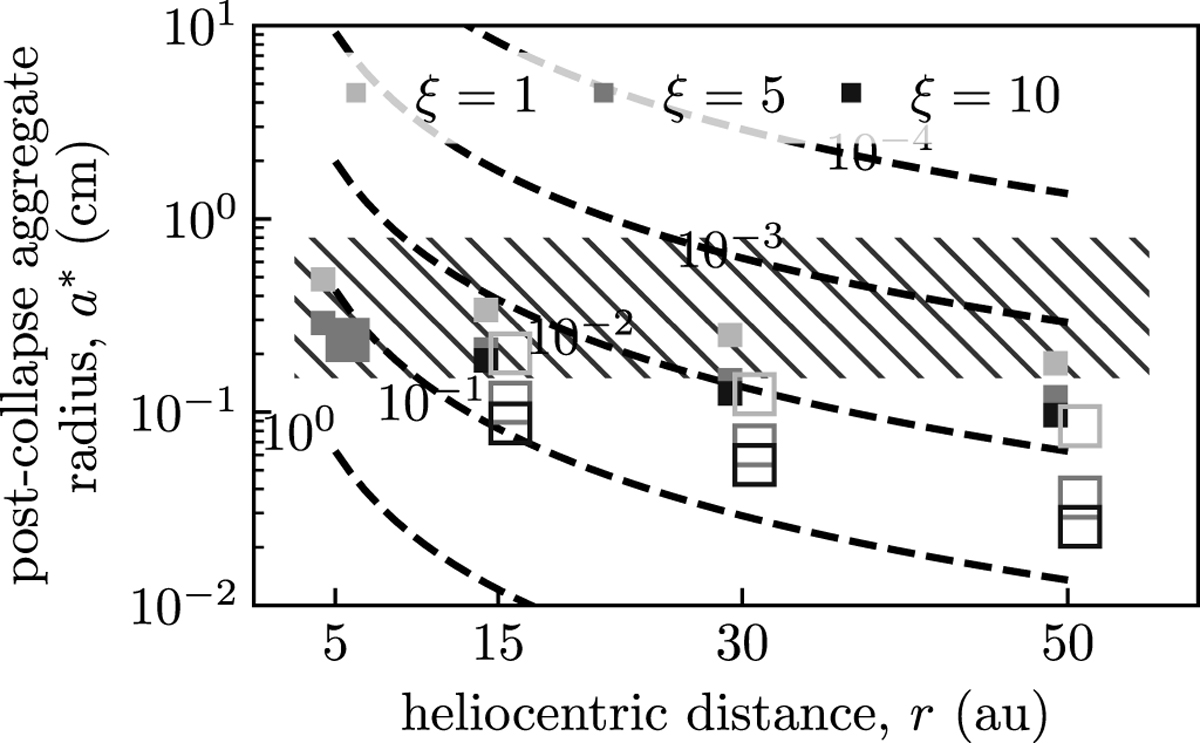
Post-collapse aggregate radius vs heliocentric distance. The hatched area marks the range of pebble sizes measured on 67 P by the CIVA camera on board Rosetta/Philae (Poulet et al. 2016). The square symbols show aggregate sizes at Stmin. Large and small symbols are for 1 μm and 0.1 μm sized monomers, respectively. Symbols are filled if aggregates might trigger the streaming instability (Table 3). Dashed lines indicate the minimum size for aggregates with a given volume-filling factor to have Stmin. ϕ0 refers to the initial aggregate porosity (i.e. before compression).
Current usage metrics show cumulative count of Article Views (full-text article views including HTML views, PDF and ePub downloads, according to the available data) and Abstracts Views on Vision4Press platform.
Data correspond to usage on the plateform after 2015. The current usage metrics is available 48-96 hours after online publication and is updated daily on week days.
Initial download of the metrics may take a while.