| Issue |
A&A
Volume 610, February 2018
|
|
|---|---|---|
| Article Number | L18 | |
| Number of page(s) | 7 | |
| Section | Letters to the Editor | |
| DOI | https://doi.org/10.1051/0004-6361/201732543 | |
| Published online | 08 March 2018 | |
Letter to the Editor
Sub-arcsecond imaging of Arp 299-A at 150 MHz with LOFAR: Evidence for a starburst-driven outflow
1
Instituto de Astrofísica de Andalucía (IAA-CSIC), Glorieta de la Astronomía s/n,
18008
Granada, Spain
e-mail: naimro@iaa.es
2
Jodrell Bank Centr for Astrophysics, Alan Turing Building, University of Manchester,
Oxford Road,
Manchester
M13 9PL, UK
3
Visiting Scientist: Facultad de Ciencias, Univ. de Zaragoza,
Zaragoza, Spain
4
Centro de Astrobiología (CSIC-INTA),
ESAC Campus,
28692
Villanueva de Cañada,
Madrid, Spain
5
Centre for Astrophysics & Supercomputing Swinburne University of Technology,
John St,
Hawthorn
VIC 3122, Australia
6
European Southern Observatory,
Alonso de Córdova 3107,
Vitacura,
Santiago, Chile
7
Joint ALMA Observatory,
Alonso de Córdova 3107,
Vitacura,
Santiago, Chile
8
National Radio Astronomy Observatory,
520 Edgemont Road,
Charlottesville,
VA
22903, USA
9
Department of Space, Earth and Environment, Chalmers University of Technology, Onsala Space Observatory,
439 92
Onsala, Sweden
Received:
23
December
2017
Accepted:
2
February
2018
We report on the first sub-arcsecond (0.44 × 0.41 arcsec2) angular resolution image at 150 MHz of the A-nucleus in the luminous infrared galaxy Arp 299, from International Low Frequency Array (LOFAR) Telescope observations. The most remarkable finding is that of an intriguing two-sided, filamentary structure emanating from the A-nucleus, which we interpret as an outflow that extends up to at least 14 arcsec from the A-nucleus in the N–S direction ( ≈5 kpc deprojected size) and accounts for almost 40% of the extended emission of the entire galaxy system. We also discuss HST/NICMOS [FeII] 1.64 μm and H2 2.12 μm images of Arp 299-A, which show similar features to those unveiled by our 150 MHz LOFAR observations, providing strong morphological support for the outflow scenario. Finally, we discuss unpublished Na I D spectra that confirm the outflow nature of this structure. From energetic arguments, we rule out the low-luminosity active galactic nucleus in Arp 299-A as a driver for the outflow. On the contrary, the powerful, compact starburst in the central regions of Arp 299-A provides plenty of mechanical energy to sustain an outflow, and we conclude that the intense supernova (SN) activity in the nuclear region of Arp 299-A is driving the observed outflow. We estimate that the starburst wind can support a mass-outflow rate in the range (11–63 M⊙ yr−1) at speeds of up to 370–890 km s−1, and is relatively young, with an estimated kinematic age of 3–7 Myr. Those results open an avenue to the use of low-frequency (150 MHz), sub-arcsecond imaging with LOFAR to detect outflows in the central regions of local luminous infrared galaxies.
Key words: galaxies / individual Arp 299 / ISM jets and outflows / galaxies star formation galaxies / starburst / radio continuum galaxies
© ESO 2018
1 Introduction
Many starburst galaxies show a low-frequency turnover (below 1.4 GHz) in their spectral energy distribution (SED; Condon 1992), which carries relevant information on the absorption processes taking place in those galaxies. However, until the advent of the International Low Frequency Array Telescope (LOFAR; van Haarlem et al. 2013), those studies lacked the necessary angular resolution and sensitivity at 150 MHz to study the low-frequency morphology of nearby luminous infrared galaxies (LIRGs) in detail. Using LOFAR at this frequency we have studied two of the most interesting starburst galaxies in the nearby universe: the closest starburst galaxy M82 (Varenius et al. 2015), and the closest ultra-luminous infrared galaxy (ULIRG) Arp 220 (Varenius et al. 2016). In this Letter we present new 150 MHz observations of the most luminous LIRG within 50 Mpc: Arp 299.
The Arp 299 galaxy is located at D ≈ 45 Mpc and exists as an interacting galaxy pair (NGC 3690A and NGC 3690B, eastern and western galaxies, respectively) in an early stage of merging. With an infrared luminosity of 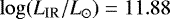 , it is the brightest known LIRG within 50 Mpc in the northern hemisphere. Radio interferometric observations of Arp 299 at centimeter wavelengths obtained with arcsecond resolution show that the two main components of the galaxy system also host the brightest radio-emitting regions (e.g., Neff et al. 2004). Moreover, very long baseline interferometry has unveiled prolific supernova (SN) factories in the central regions of Arp 299-A (Pérez-Torres et al. 2009b; Ulvestad 2009; Bondi et al. 2012). This central SN factory fits well with the observed behavior in merger systems, which have more molecular gas (≈3 × 10⁹ M⊙, Rosenberg et al. 2014) than non-interacting galaxies (Combes et al. 1994; Casasola et al. 2004). It has also been proved that this gas tends to be concentrated in the nuclear regions of the merging galaxies (Braine & Combes 1993).
Here, we present the first results from our observations of Arp 299, focusing on the A-nucleus, where we have found evidence for a nuclear outflow powered by the intense starburst activity in the central kpc region of Arp 299-A. The outflow is detected at these radio wavelengths since it transports synchrotron-emitting cosmic rays (CRs) and almost the whole of its structure is unaffected by absorption.
2 Observations
We present data taken with LOFAR at 150 MHz for 12 h during the night between 22 and 23 February 2016 under project code LC5_20 (P.I. Pérez-Torres, M.). Three simultaneous beams were used with the same 32 MHz frequency coverage, centered at 150 MHz, to observe the target Arp 299 and the two calibrators J1127+5841 (calibrator for phase, 10′ from Arp 299) and J1128+5925 (calibrator for delay/rate/amplitude/bandpass, 0.8∘ from Arp 299). Every 30 min the observations switched to a single beam on the absolute flux density calibrator 3C 295 for 3 min; see Table A.1 for source positions. The data were correlated in linear polarization (XX, XY, YX, YY) and stored in the LOFAR Long Term Archive (LTA) averaged to 4 s in time and 4 channels per sub-band (i.e., a frequency resolution of 48.75 kHz). This limits the 10% smearing radius for international baselines to about 5′ around the respective beam centers for 1000 km baselines. For a more detailed explanation of the reduction process with LOFAR.
In addition, for the NaI line absorption analysis, we also present INTEGRAL, a fiber-based integral field system (Arribas et al. 1998) and observations of Arp 299-A that were performed on 3 May 2014. INTEGRAL is connected to the Wide Field Fibre Optic Spectrograph (WYFFOS; Bingham et al. 1994)attached to the 4.2 m WHT in La Palma. The set up was the R120, the four exposures from the ING (Isaac Newton Group) archive at the Cambridge Astronomy Survey Unit (CASU) of the Astronomical Data Centre (ADC). The exposures were median combined and different spectra were extracted from the nucleus and from an adjacent region.
3 Results
We show in Fig. 1 the Arp 299-A image (0.44 × 0.41 arcsec2) obtained from our LOFAR 150 MHz observations. The rms achieved is ≈90 μJy beam−1. The peak of brightness of the image is located at RA = 11h28m33.487s Dec = +58∘33′47.044″ (J2000.0), with a value of 21.5 mJy beam−1, and corresponds to the brightest point in the entire Arp 299 system.
The low-surface-brightness component (which we define as regions with signal-to-noise 3σ < S150 MHz < 50σ) of the image accounts for 40% of the extended emission of the entire galaxy, and is about four times more luminous than the A nucleus (which we define as the region with signal-to-noise >50 σ). The distribution of this emission forms a biconical structure with an extension ≈14 arcsec in length and a maximum width ≈8 arcsec. The northern region shows edge-brightening. However, in the southern region this behavior has not been detected, showing a more uniform emission distribution.
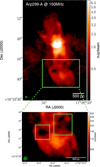 |
Fig. 1 Upper panel: LOFAR Image of Arp 299-A at 150 MHz with a beam of 0.44 × 0.41 arcsec2 (Position Angle = − 51.88∘) and a sensitivity of rms = 90 μJy beam−1. Lower panel: zoomed image of the region of ≈1.2 × 1.6 kpc marked with a green box in the upper panel. The absorbed regions of the southern part of the outflow are indicated with green boxes. The sizes are approximately 330 pc × 380 pc (left) and 420 pc × 500 pc (right). |
4 Discussion
4.1 An outflowing wind unveiled with LOFAR?
The most remarkable finding of our 150 MHz LOFAR observations is an intriguing two-sided, wide filamentary structure emanating from the A-nucleus that extends up to at least 14 arcsec ( ≃3 kpc) from the A-nucleus in the N–S direction. The peculiar shape of this extended emission is very suggestive of an outflow (e.g., Su et al. 2010; Barcos-Muñoz et al. 2018; McKinley et al. 2018).
The presence of obscured regions seen only in the southern part, at a distance of ≈1.1 kpc from the A nucleus (see green boxes in Fig. 1), suggests thepresence of a nonuniform (clumpy) distribution of absorbers over the emitter. This is consistent with the existence of a spiral arm of the galactic disk seen before in, for example, Fig. 9, left panel, second row Alonso-Herrero et al. (2000). The northern part of the structure appears less obscured. This absorption structure is consistent with a bipolar structure emanating from the center of an inclined absorbing galactic disk (Fig. A.1). Considering that the disk may host star-forming regions with ionized gas (HII regions), these would produce free-free absorption (Condon 1992), being the natural cause of the absorption at 150 MHz. This behavior also indicates that, although the predominant star formation activity is located at the nuclei of the interacting galaxies, ongoing star formation is also present in the spiral disk. This was also previously suggested for Arp 299 by Alonso-Herrero et al. (2000) in particular, and in other interacting galaxies in general (M 81 of the M 81 group Kaufman et al. 1989; Casasola et al. 2007; NGC 3627 of the Leo Triplet Smith et al. 1994; Paladino et al. 2008). Therefore, considering that what is seen here is a unique structure crossing the nucleus, and together with the filamentary shape of the northern (nonabsorbed) region, everything suggests that this structure is an outflow.
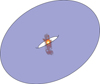 |
Fig. A.1 Sketch of the outflow in Arp 299-A (IC694), where the emulated disk covers around 60 arcsec in the major axis and the inclination of the disk is ≈30∘. The cloudsare located in the galactic disk (dark blue torus), thus obscuring the southern part of the outflow. The sketch tries also to represent the real inclination of the galactic disk. |
4.2 Ancillary data at other wavelengths
NICMOS/HST [FeII] and H2 line emission: In Fig. A.2 we present the H2 (2.12 μm) and FeII (1.644 μm) emission-line images from Alonso-Herrero et al. (2000). The images represent the same region of Arp 299-A, using a logarithmic color scale to enhance the faint, extended emission. The structures present in both images also trace a similar bi-conical behavior of the extended emission similar to that of the 150 MHz counterpart. The principal causes of the ro-vibrational transitions of H2 are the fluorescent excitation (“UV pumping”) and the processes associated with thermal causes (collisions). In the work of Moorwood & Oliva (1990), they conclude that in a starburst galaxy, as is the case of Arp 299, the most plausible scenario is the one that favors the collisions, for example, the shock of an outflow with the interstellar medium (ISM). On the other hand, the existence of [FeII] emission could be associated with both compact objects or extended emission. The SNe are responsible for the compact emission, coming from the ionized medium after the shocks produced in the explosions propagate through the ISM, while in the form of extended emission is directly related with nuclear outflows (Greenhouse et al. 1997; Alonso-Herrero et al. 2003). The image of FeII presents a combination of biconical structure and extended emission following a spiral pattern. As pointed out in the previous subsection, this can be explained as being due to the outhern part being covered by the ongoing starburst in the galactic disk, which distorts or generates emission not directly related with the outflow but with the spiral arms. Therefore, here we focus on the northern part to avoid any potential FeII emission from SN shocks inherent to the clumpy disk. The bulk of the emission originates in the nucleus, but there is a very faint structure to the north that follows the same shape as the putative outflow and that is brighter at the edges, thus resembling filaments.This enhanced emission may be the result of FeII emitter stacking, the trigger of a process that favors the FeII or both scenarios combined. As Arp 299-A is an ongoing factory of SNe (Pérez-Torres et al. 2009b), one might ask if the FeII extended emission is the sum of all the generated compact FeII emission plus the winds associated in the region. The presence of this emission up to 2.5 kpc away from the nucleus, where the bulk of SNe live, cannot be explained by an emission generated by shocked material in the nucleus and transported northwards, emitting FeII on its way towards the regions of enhanced emission. Even though the outflow is most likely generated by the SN factory present in the nucleus, the FeII emission observed in the northern component is most likely coming from shocks produced by the outflow itself.
The filament in the FeII image observed in the NW region matches the edge of the emission in both H2 and at 150 MHz. The co-existence of H2 and FeII in the same region indicates that the process behind these lines is an outflow that produces shocks with the ISM in its wake (Moorwood & Oliva 1990).
NaI absorption in the nucleus: Because of its low ionization potential, the resonant NaI D lines are a good tracer of the neutral ISM. NaI absorption was used in the pioneering work of Phillips (1993) as a probe of a superwind in NGC 1808, and in a systematic study of 32 FIR bright starburst galaxies by Heckman et al. (2000). Moreover, these double sodium absorption lines have been used in the study of outflows in ULIRGS (Rupke et al. 2005a, 2005b). Figure 2 shows the spectra around the NaI D lines λλ5889.95, 5895.92 extracted from the nucleus (blue line) and from an adjacent region (in red). The absorption is redshifted in the outer regions, indicating a large amount of outflowing dense neutral medium.
The spectra are flux normalized in the continuum window 5805–5930 Å.
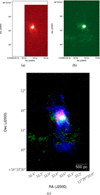 |
Fig. A.2 Images of H2 (panel a) and FeII (panel b) from Alonso-Herrero et al. (2000). H2 is represented in linear scale, while FeII is in logarithmic scale. The H2 image is blanked in the left and upper regions since those regions were not covered by NICMOS observations. The composite RGB image (panel c) of the same region of Arp 299-A H2 and FeII, and the LOFAR image at 150 MHz, in red, green and blue, respectively. |
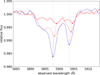 |
Fig. 2 NaI Dlines in the nucleus (blue) and in two adjacent fibers corresponding to outer regions (red). The outer profiles are blueshifted indicating an outflow. Dots indicate the local minimum of the line. Dashed vertical lines indicate the reference wavelength positions of the absorption lines in the nucleus. The spectra is flux normalized in the continuum window 5805–5930 Å. |
4.3 The nature of the outflow in Arp 299-A
There is little doubt that the LOFAR 150 MHz morphology of the extended emission in the central regions of Arp 299-A, in addition to the morphology of the Fe II and H2 near-IR observations and the NI D spectra, signals the existence of an outflow in the nucleus of Arp 299-A. Arp 299-A is known to host a low-luminosity active galactic nuclei (LLAGN; Pérez-Torres et al. 2010; Alonso-Herrero et al. 2013) defined as an AGN with L(Hα) ≤ 1040 erg s−1 (Ho et al. 1997), although its precise nature (Seyfert or LINER) is still unknown. Further, it also presents a powerful starburst (Pérez-Torres et al. 2009b; Ulvestad 2009; Bondi et al. 2012)in its nuclear region. Thus, a natural question arises regarding the mechanism that is powering the outflow. Is it the LLAGN in Arp 299-A, or is it a compact starbust?
AGNs can drive outflows in the central regions of galaxies, as their accretion power can be very high (e.g., Veilleux et al. 2005):
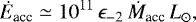 (1)
(1)
where Ṁacc is the mass accretion rate in  and ϵ−2 = ϵ∕0.01 is the energy conversion efficiency in rest mass units. The mass accretion rate ranges from ≲0.001 M⊙ yr−1 for low-luminosity AGN, ~1 M⊙ yr−1 for Seyfert galaxies, and ~100 M⊙ yr−1 for quasars and powerful radio galaxies (Veilleux et al. 2005).
EVN observations of Arp 299-A showed that Arp 299-A hosts an LLAGN at its center (Pérez-Torres et al. 2010), with  (Alonso-Herrero et al. 2013), surrounded by a large core-collapse supernova factory (Pérez-Torres et al. 2009b). The accretion power of the LLAGN in Arp 299-A is unlikely to be larger than Ė acc ≃ 3.8 × 1041ϵ−2 erg s−1, but still might produce outflow phenomena as is the case in, for example, NGC 1433 (Combes et al. 2013), or NGC 1068 (García-Burillo et al. 2014).
We should note that one major problem with the scenario of a LLAGN-driven outflow for Arp 299-A is the orientation ofthe jet. We know from our previous EVN observations (Pérez-Torres et al. 2010) that the radio jet emanating from the AGN in Arp 299-A is oriented along the east–west direction, while the outflow unveiled by LOFAR is in the north–south direction, almost perpendicular (in the projected plane) to the AGN jet.
The main alternative scenario is that of a starburst driving the outflow, given the existence of intense supernova activity in the central ~150 pc (Pérez-Torres et al. 2009b; Bondi et al. 2012). In the early stages of a starburst, that is, before core collapse supernovae (CCSNe) start exploding, the main input of mechanical energy into the ISM is through stellar winds, in particular those of Wolf-Rayet stars (Leitherer et al. 1999). However, soon after CCSNe come into play, their mechanical input dominates for starburst ages ≥6 Myr (see, e.g., Figs. 108 and 114 of Leitherer et al. 1999). Given that we have direct observational evidence of ongoing CCSNe explosions in the central ~150 pc of Arp 299-A from our own VLBI observations (Pérez-Torres et al. 2009b; Bondi et al. 2012) and an estimation of 10–15 Myr for the starburst age (Alonso-Herrero et al. 2000), we consider here only the mechanical input from CCSNe, for the sake of simplicity. Bondi et al. (2012) found a lower limit to the CCSNe rate in Arp 299-A of  . Assuming standard values for the energy of CCSN explosions, ESN = 1051 E51 erg (where E51 is the energy in units of 1051 erg), and for the conversion efficiency of the energy of the explosion into mechanical energy, η = 0.1 η−1 (Thornton et al. 1998), we obtain Ėsb ≃ 3.2 × 1042 rSN,1 η−1 erg s−1, where rSN,1 = rSN∕yr−1. The available mechanical energy due to SN activity is almost ten times larger than that due to AGN activity in Arp 299A, and hence a starburst can account for the observed outflow much more easily than the LLAGN.
We can also estimate the maximum outflowing mass-loss rate of a starburst-driven outflow, as follows:
 (2)
(2)
where v2 = v∕100 km s^-1 is the outflow speed, in units of  . Starburst-driven outflows show wind speeds of about
  (Veilleux et al. 2005), so the maximum outflowing mass rate supported by the starburst is
  . We can independently obtain another estimate for the starburst mass outflow rate, using the approximation in Veilleux et al. (2005):
 (3)
(3)
where SFR is the star formation rate ( ), solar-metallicity is assumed, and the starburst age is beyond ~40 Myr, implying that the mass-loss rate and mechanical luminosity are constant. Assuming, for simplicity, a constant SFR, the CCSN rate for a Salpeter initial mass function is approximately
  (e.g., Eq. (9) in Pérez-Torres et al. 2009a), and the above expression becomes
  , or about 11
  for the case of Arp 299-A.
We can now rewrite Eq. (2) to obtain the outflow speed:
 (4)
(4)
where Ṁsb is in units of  . We thus obtain the range of mass outflow rates ≃11–63
  . Substituting those values into the previous equation, and using
  from our VLBI observations, we obtain outflow speeds in the range v ≃ 370–890
  , which are in broad agreement with observed wind speeds in starburst-driven outflows (e.g., Veilleux et al. 2005).
The range of velocities estimated above, in addition to the physical size of the outflow and the position of the nuclear starburst can help to get an idea of the age of the outflow. However, this length is affected by the projection on the sky of the real outflow, so, primarily, we must deproject it (HyperLeda1 angle value is i ≈ 52∘). Therefore, the total size of the outflow would be ≈5 kpc. Since the compact starburst in Arp 299-A surrounds the A nucleus (Pérez-Torres et al. 2009b), the outflow radius is then 2.5 kpc. For the range of velocities obtained above 370–890  , the kinematic age of the outflow is (3–7 Myr).
5 Summary and conclusions
We have presented for the first time highly sensitive, sub-arcsecond ( ~0.4 arcsec) LOFAR observations at 150 MHz of the merging galaxy system Arp 299, focusing on the Arp 299-A nucleus.
Our main finding is the presence of a two-sided, wide filamentary structure emanating from the A-nucleus, which we interpret as an outflow that extends up to at least ≃3 kpc from the A-nucleus along the N–S direction. Published HST/NICMOS [FeII] and H2 at 2.12 μm images of Arp 299-A (Alonso-Herrero et al. 2000) show very similar features to those obtained by us with LOFAR at 150 MHz, providing further morphological support for the putative outflow. Finally, previously unpublished NaI D spectra show a Doppler shift in this absorbed lines between the A nucleus and other two surrounding regions, also reinforcing the existence of an outflow in Arp 299-A.
We discuss two main scenarios to power the outflow, namely that of a starburst, or that of an AGN. The mechanical energy available from the starburst in the central regions of Arp 299-A is very large, Ėsb ≃ 3.2 × 1042 rSN,1 η−1 erg s−1 due to the large core-collapse supernova rate (Bondi et al. 2012). On the other hand, the mechanical energy due to the accretion power of the LLAGN sitting at the center of Arp 299-A is almost ten times smaller. We thus conclude that the outflow in Arp 299-A is driven by the powerful starburst in its central regions. We estimate that the starburst wind can support a mass-outflow rate in the range (11–63)  at speeds of up to 370–890
  , and that it is relatively young, with an estimated kinematic age of 3–7 Myr.
Our results indicate that sub-arcsecond imaging with LOFAR may be an excellent new tool for unveiling outflows in the central regions of local LIRGs. Appendix A:
Appendix A LOFAR at 150 MHz
Observations were taken in an 8-bit mode with the high band antenna (HBA) part of LOFAR in dual_inner configuration. This means that each of the two “ears” of the 24 core stations were correlated as separated stations. This provides many more short baselines between core stations, which enable future legacy studies of extended emission on much larger scalesthan we study in this paper. A total of 71 LOFAR stations participated: 48 core stations (CS), 14 remote stations (RS) and 9 international stations (IS). Unfortunately the data from the Swedish station SE607HBA could not be calibrated and were excluded from our analysis2 .
A.1 Pre-averaging and flagging
The LTA stores data as one compressed measurement set (MS) per subband (162) per source (4) per scan (24; 30 min, or 3 min for 3C 295), that is, about 2.8 TB of data spread over about 15 500 files. After downloading all files from the LTA we used LOFAR Default Processing Pipeline (DPPP) to apply the LOFAR beam model, combined all files in frequency for each scan and source, and averaged further to 8 s in time and 195 kHz per channel to reduce processing time. This limits the smearing radius to about 1′ for a 1000 km baseline. We ran the standard LOFAR software AOFlagger v2.8 (Offringa et al. 2012) with default parameters to remove radio frequency interference (RFI) signals from the data. We then used DPPP to derive phase-corrections for all CS using a point source model of 3C 295, using the scans on 3C 295. The corrections were extended in time to allow application of the derived corrections to the interleaved scans of Arp 299 and the two calibrators. After applying the phase corrections, thereby aligning the phases of the CS, we used DPPP to combine stations into super-stations to increase processing time and baseline sensitivity. CS 2, 3, 4, 5, 6, and 7 were joined together into a “super terp” station (ST). For the remaining CS we joined the “ears” together for each station. Hence we produced an averaged and summed data set with 41 stations: 14 RS, 8 IS, 18 CS and one phased ST. Next, we used CASA 5.1.1 task concat to concatenate the scans to one single MS per source. These four MSs were converted from linear to circular polarization using the Table Query Language (TAQL) utility mscal.stokes. Finally, the task exportuvfits in CASA was used to export the data to UVFITS-format for processing in the NRAO Astronomical Image Processing System (AIPS release 31DEC16; see e.g., Greisen 2003). We used the ParselTongue Python interface (Kettenis et al. 2006) version 2.3 to script AIPS tasks.
A.2 Calibration and imaging
The AIPS calibration strategy was very similar to the one used for M 82 and Arp 220 by (2015, 2016), and therefore only the key points are summarized here. Residual delays, rates and amplitude errors were calibrated using AIPS towards J1128+5925, assuming this source to be 270 mJy with flat spectrum throughout the 32 MHz observing band. The data were split into four 8-MHz spectral windows to enable a nondispersive (linear) correction for phase slopes versus frequency using the task FRING in AIPS with a minimum baseline length of 60 kλ. We used a solution interval in FRING of 1 min for IS and 2 min for RS. After FRING the data were averaged to 24 s in time. Bandpass corrections were derived towards J1128+5925 once every hour and the data were then averaged to 780 kHz per channel for calibrators and 390 kHz per channel for Arp 299, which at this point implies a 10% smearing radius of about 20″ and 35″, respectively, for 1000 km baselines. An iterative self-calibration loop was used to calibrate the relative amplitude scale using J1128+5925 to account for possible source structure. The calibration was transferred to 1127+5841 where the phases were refined assuming a point source model, and all cumulative corrections were applied to Arp 299. The corrections derived towards J1128+5925 were also transferred to 3C 295 to check the absolute flux density scale. Finally, Arp 299 was imaged using the CLEAN deconvolution algorithm as implemented in the AIPS task IMAGR, including baselines longer than 5 kλ to sample also the extended emission.
References
- Alonso-Herrero, A., Rieke, G. H., Rieke, M. J., & Kelly, D. M. 2003, AJ, 125, 1210 [NASA ADS] [CrossRef] [Google Scholar]
- Alonso-Herrero, A., Rieke, G. H., Rieke, M. J., & Scoville, N. Z. 2000, ApJ, 532, 845 [NASA ADS] [CrossRef] [Google Scholar]
- Alonso-Herrero, A., Roche, P. F., Esquej, P., et al. 2013, ApJ, 779, L14 [NASA ADS] [CrossRef] [Google Scholar]
- Arribas, S., del Burgo, C., Carter, D., et al. 1998, in Fiber Optics in Astronomy III, eds. S. Arribas, E. Mediavilla, & F. Watson, ASP Conf. Ser., 152, 149 [NASA ADS] [Google Scholar]
- Barcos-Muñoz, L., Aalto, S., Thompson, T. A., et al. 2018, ApJ, 853, L28 [NASA ADS] [CrossRef] [Google Scholar]
- Bingham, R. G., Gellatly, D. W., Jenkins, C. R., & Worswick, S. P. 1994, in Instrumentation in Astronomy VIII, eds. D. L. Crawford, & E. R. Craine, Proc. SPIE, 2198, 56 [NASA ADS] [CrossRef] [Google Scholar]
- Bondi, M., Pérez-Torres, M. A., Herrero-Illana, R., & Alberdi, A. 2012, A&A, 539, A134 [NASA ADS] [CrossRef] [EDP Sciences] [Google Scholar]
- Braine, J., & Combes, F. 1993, A&A, 269, 7 [NASA ADS] [Google Scholar]
- Casasola, V., Bettoni, D., & Galletta, G. 2004, A&A, 422, 941 [NASA ADS] [CrossRef] [EDP Sciences] [Google Scholar]
- Casasola, V., Combes, F., Bettoni, D., & Galletta, G. 2007, A&A, 473, 771 [NASA ADS] [CrossRef] [EDP Sciences] [Google Scholar]
- Combes, F., Prugniel, P., Rampazzo, R., & Sulentic, J. W. 1994, A&A, 281, 725 [NASA ADS] [Google Scholar]
- Combes, F., García-Burillo, S., Casasola, V., et al. 2013, A&A, 558, A124 [NASA ADS] [CrossRef] [EDP Sciences] [Google Scholar]
- Condon, J. J. 1992, ARA&A, 30, 575 [NASA ADS] [CrossRef] [MathSciNet] [Google Scholar]
- García-Burillo, S., Combes, F., Usero, A., et al. 2014, A&A, 567, A125 [NASA ADS] [CrossRef] [EDP Sciences] [Google Scholar]
- Greenhouse, M. A., Satyapal, S., Woodward, C. E., et al. 1997, ApJ, 476, 105 [NASA ADS] [CrossRef] [Google Scholar]
- Greisen, E. W. 2003, Information Handling in Astronomy – Historical Vistas, 285, 109 [NASA ADS] [CrossRef] [Google Scholar]
- Heckman, T. M., Lehnert, M. D., Strickland, D. K., & Armus, L. 2000, ApJS, 129, 493 [NASA ADS] [CrossRef] [MathSciNet] [Google Scholar]
- Ho, L. C., Filippenko, A. V., & Sargent, W. L. W. 1997, ApJS, 112, 315 [NASA ADS] [CrossRef] [Google Scholar]
- Kaufman, M., Bash, F. N., Hine, B., et al. 1989, ApJ, 345, 674 [NASA ADS] [CrossRef] [Google Scholar]
- Kettenis, M., van Langevelde, H. J., Reynolds, C., & Cotton, B. 2006, in Astronomical Data Analysis Software and Systems XV, eds. C. Gabriel, C. Arviset, D. Ponz, & S. Enrique, ASP Conf. Ser., 351, 497 [NASA ADS] [Google Scholar]
- Leitherer, C., Schaerer, D., Goldader, J. D., et al. 1999, ApJS, 123, 3 [NASA ADS] [CrossRef] [Google Scholar]
- McKinley, B., Tingay, S. J., Carretti, E., et al. 2018, MNRAS, 474, 4056 [NASA ADS] [CrossRef] [Google Scholar]
- Moorwood, A. F. M. & Oliva, E. 1990, A&A, 239, 78 [NASA ADS] [Google Scholar]
- Neff, S. G., Ulvestad, J. S., & Teng, S. H. 2004, ApJ, 611, 186 [NASA ADS] [CrossRef] [Google Scholar]
- Offringa, A. R., van de Gronde, J. J., & Roerdink, J. B. T. M. 2012, A&A, 539, A95 [NASA ADS] [CrossRef] [EDP Sciences] [Google Scholar]
- Paladino, R., Murgia, M., Tarchi, A., Moscadelli, L., & Comito, C. 2008, A&A, 485, 679 [NASA ADS] [CrossRef] [EDP Sciences] [Google Scholar]
- Pérez-Torres, M. A., Alberdi, A., Colina, L., et al. 2009a, MNRAS, 399, 1641 [NASA ADS] [CrossRef] [Google Scholar]
- Pérez-Torres, M. A., Romero-Cañizales, C., Alberdi, A., & Polatidis, A. 2009b, A&A, 507, L17 [NASA ADS] [CrossRef] [EDP Sciences] [Google Scholar]
- Pérez-Torres, M. A., Alberdi, A., Romero-Cañizales, C., & Bondi, M. 2010, A&A, 519, L5 [NASA ADS] [CrossRef] [EDP Sciences] [Google Scholar]
- Phillips, A. C. 1993, AJ, 105, 486 [NASA ADS] [CrossRef] [Google Scholar]
- Rosenberg, M. J. F., Meijerink, R., Israel, F. P., et al. 2014, A&A, 568, A90 [NASA ADS] [CrossRef] [EDP Sciences] [Google Scholar]
- Rupke, D. S., Veilleux, S., & Sanders, D. B. 2005a, ApJ, 632, 751 [Google Scholar]
- Rupke, D. S., Veilleux, S., & Sanders, D. B. 2005b, ApJS, 160, 87 [Google Scholar]
- Smith, B. J., Harvey, P. M., Colome, C., et al. 1994, ApJ, 425, 91 [NASA ADS] [CrossRef] [Google Scholar]
- Su, M., Slatyer, T. R., & Finkbeiner, D. P. 2010, ApJ, 724, 1044 [NASA ADS] [CrossRef] [Google Scholar]
- Thornton, K., Gaudlitz, M., Janka, H.-T., & Steinmetz, M. 1998, ApJ, 500, 95 [NASA ADS] [CrossRef] [Google Scholar]
- Ulvestad, J. S. 2009, AJ, 138, 1529 [NASA ADS] [CrossRef] [Google Scholar]
- van Haarlem, M. P., Wise, M. W., Gunst, A. W., et al. 2013, A&A, 556, A2 [NASA ADS] [CrossRef] [EDP Sciences] [Google Scholar]
- Varenius, E., Conway, J. E., Martí-Vidal, I., et al. 2015, A&A, 574, A114 [NASA ADS] [CrossRef] [EDP Sciences] [Google Scholar]
- Varenius, E., Conway, J. E., Martí-Vidal, I., et al. 2016, A&A, 593, A86 [NASA ADS] [CrossRef] [EDP Sciences] [Google Scholar]
- Veilleux, S., Cecil, G., & Bland-Hawthorn, J. 2005, ARA&A, 43, 769 [Google Scholar]
HyperLeda: http://leda.univ-lyon1.fr
Although the delays and phases calibrate well, the visibility amplitudes in the upper third quartile of the data channels from SE607HBA cannot be calibrated. Due to the beam configuration in LC5_20, calibration transfer is not possible for this station. This issue was first reported for cycle 2 data by Varenius et al. (2016) and seen in cycle 7 data from March 2017.
All Tables
All Figures
|
Fig. 1 Upper panel: LOFAR Image of Arp 299-A at 150 MHz with a beam of 0.44 × 0.41 arcsec2 (Position Angle = − 51.88∘) and a sensitivity of rms = 90 μJy beam−1. Lower panel: zoomed image of the region of ≈1.2 × 1.6 kpc marked with a green box in the upper panel. The absorbed regions of the southern part of the outflow are indicated with green boxes. The sizes are approximately 330 pc × 380 pc (left) and 420 pc × 500 pc (right). |
| In the text | |
|
Fig. A.1 Sketch of the outflow in Arp 299-A (IC694), where the emulated disk covers around 60 arcsec in the major axis and the inclination of the disk is ≈30∘. The cloudsare located in the galactic disk (dark blue torus), thus obscuring the southern part of the outflow. The sketch tries also to represent the real inclination of the galactic disk. |
| In the text | |
|
Fig. A.2 Images of H2 (panel a) and FeII (panel b) from Alonso-Herrero et al. (2000). H2 is represented in linear scale, while FeII is in logarithmic scale. The H2 image is blanked in the left and upper regions since those regions were not covered by NICMOS observations. The composite RGB image (panel c) of the same region of Arp 299-A H2 and FeII, and the LOFAR image at 150 MHz, in red, green and blue, respectively. |
| In the text | |
|
Fig. 2 NaI Dlines in the nucleus (blue) and in two adjacent fibers corresponding to outer regions (red). The outer profiles are blueshifted indicating an outflow. Dots indicate the local minimum of the line. Dashed vertical lines indicate the reference wavelength positions of the absorption lines in the nucleus. The spectra is flux normalized in the continuum window 5805–5930 Å. |
| In the text | |
Current usage metrics show cumulative count of Article Views (full-text article views including HTML views, PDF and ePub downloads, according to the available data) and Abstracts Views on Vision4Press platform.
Data correspond to usage on the plateform after 2015. The current usage metrics is available 48-96 hours after online publication and is updated daily on week days.
Initial download of the metrics may take a while.