Fig. A.2
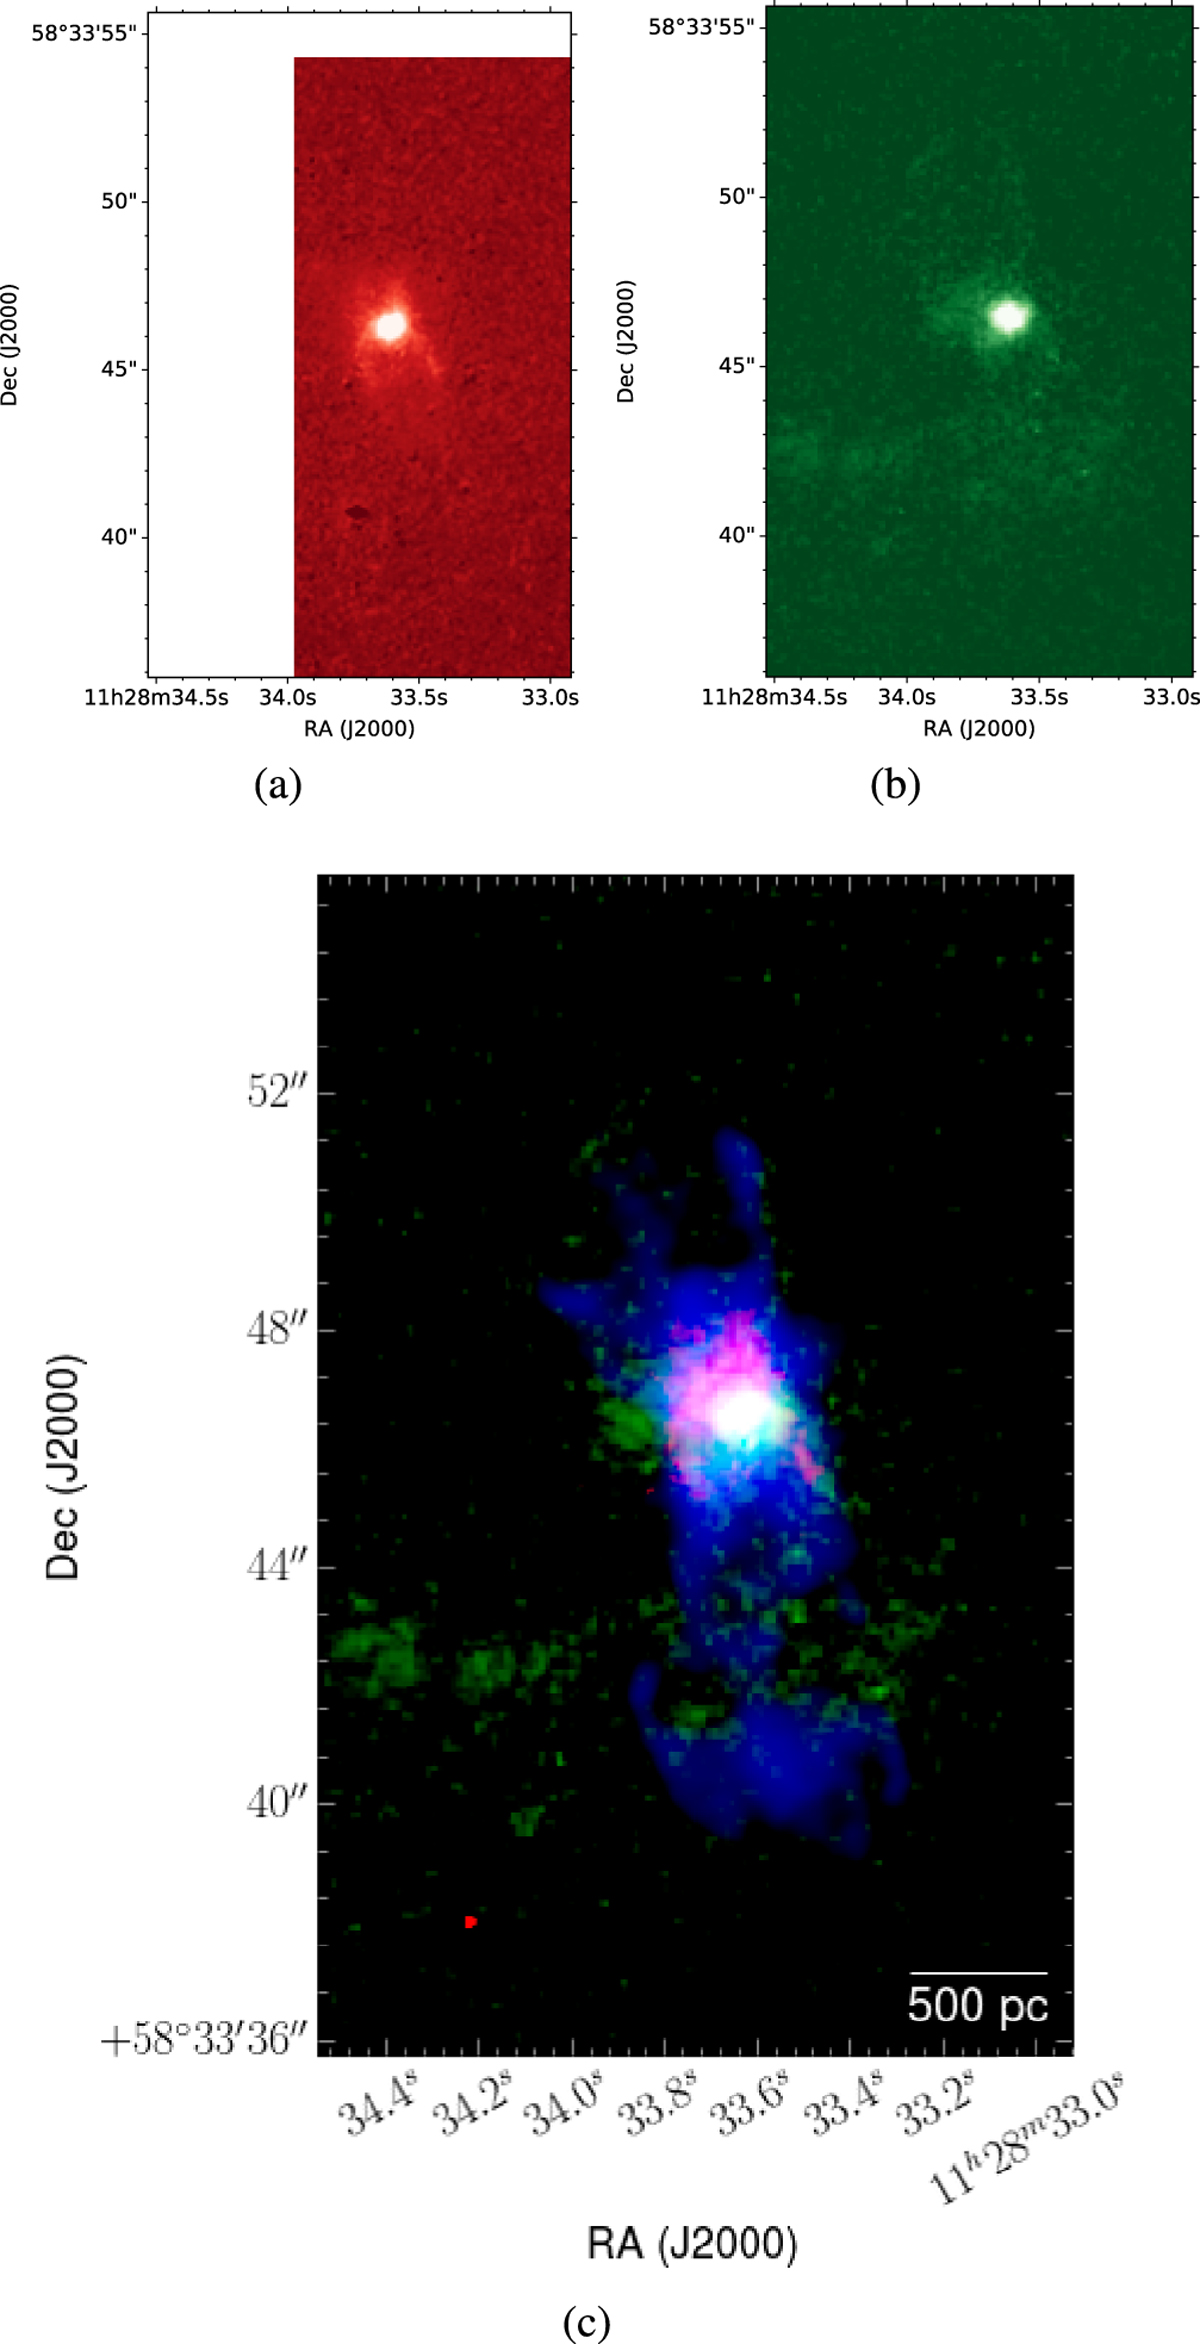
Images of H2 (panel a) and FeII (panel b) from Alonso-Herrero et al. (2000). H2 is represented in linear scale, while FeII is in logarithmic scale. The H2 image is blanked in the left and upper regions since those regions were not covered by NICMOS observations. The composite RGB image (panel c) of the same region of Arp 299-A H2 and FeII, and the LOFAR image at 150 MHz, in red, green and blue, respectively.
Current usage metrics show cumulative count of Article Views (full-text article views including HTML views, PDF and ePub downloads, according to the available data) and Abstracts Views on Vision4Press platform.
Data correspond to usage on the plateform after 2015. The current usage metrics is available 48-96 hours after online publication and is updated daily on week days.
Initial download of the metrics may take a while.