Fig. 2
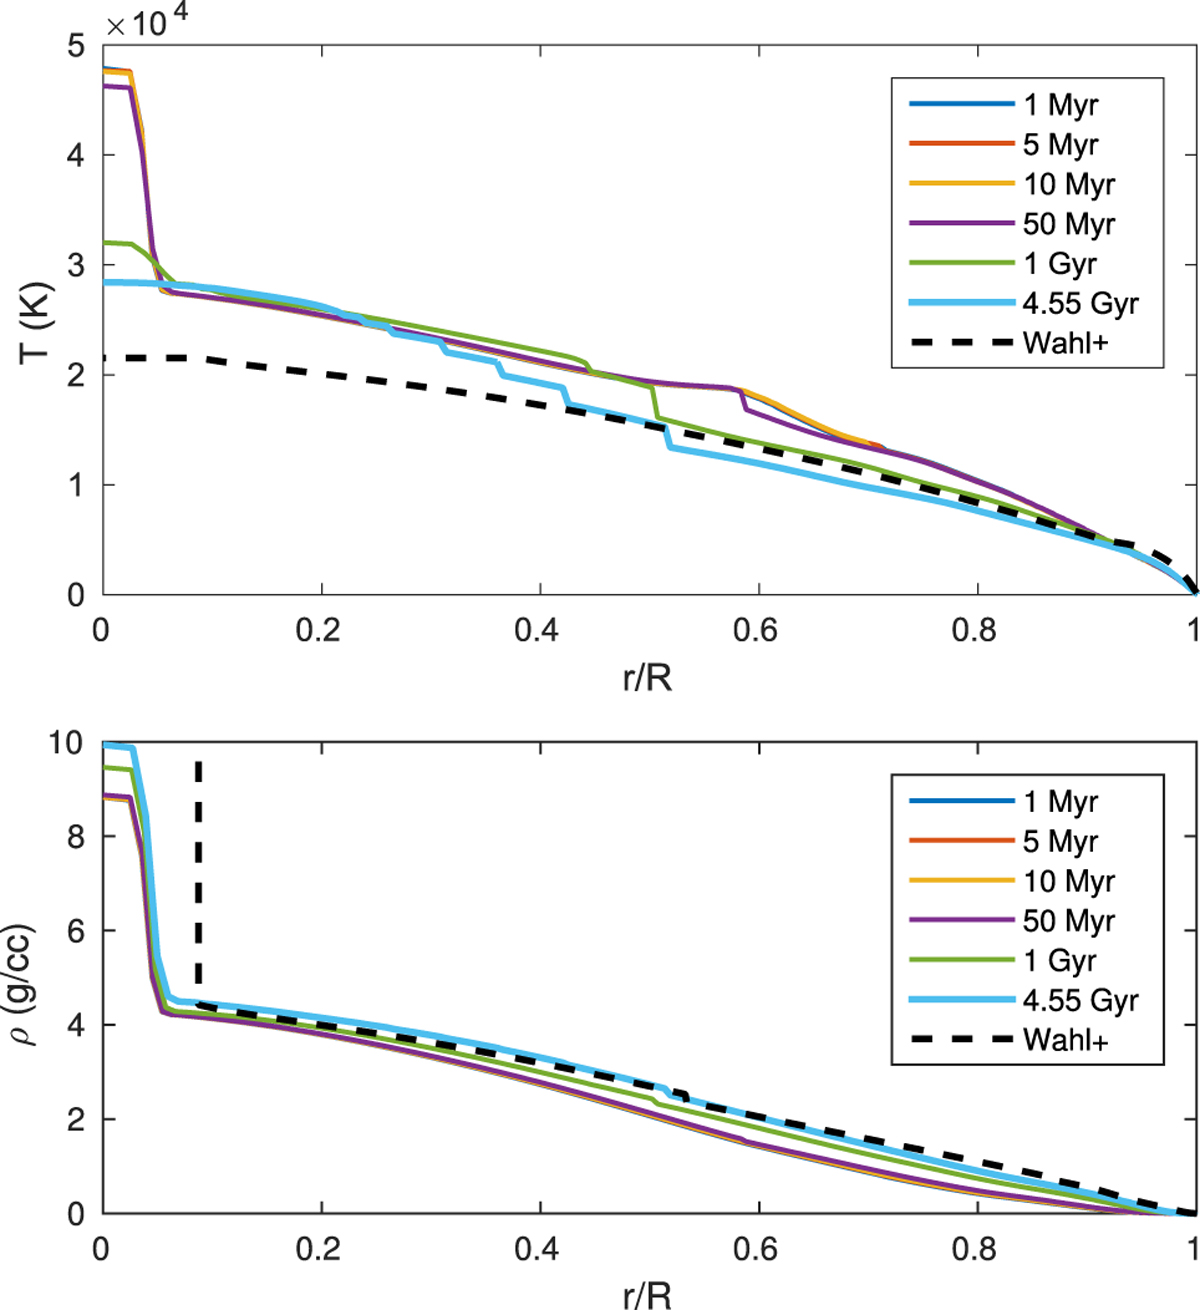
Temperature (top) and density (bottom) vs. normalized radius at different ages. The different colors are for different times during Jupiter’s evolution, as appears in the legend. The black dashed lines represents the profiles of Jupiter today assuming an adiabatic interior (Wahl et al. 2017). The evolution of the temperature (as a function of radius and mass) is available as online movies: temperatureR, temperatureM.
Current usage metrics show cumulative count of Article Views (full-text article views including HTML views, PDF and ePub downloads, according to the available data) and Abstracts Views on Vision4Press platform.
Data correspond to usage on the plateform after 2015. The current usage metrics is available 48-96 hours after online publication and is updated daily on week days.
Initial download of the metrics may take a while.