| Issue |
A&A
Volume 610, February 2018
|
|
|---|---|---|
| Article Number | L7 | |
| Number of page(s) | 5 | |
| Section | Letters to the Editor | |
| DOI | https://doi.org/10.1051/0004-6361/201732457 | |
| Published online | 20 February 2018 | |
Letter to the Editor
Discovery of a dual AGN at z ≃ 3.3 with 20 kpc separation
1
Max-Planck-Institut für Astronomie,
Königstuhl 17,
69117
Heidelberg, Germany
e-mail: This email address is being protected from spambots. You need JavaScript enabled to view it.
2
Institut für Physik und Astronomie, Universität Potsdam,
Karl-Liebknecht-Str. 24/25,
14476
Potsdam, Germany
3
European Southern Observatory,
Karl-Schwarzchild-Str. 2,
85748
Garching bei München, Germany
4
Centre for Extragalactic Astronomy, Durham University,
South Road,
Durham
DH1 3LE, UK
Received:
13
December
2017
Accepted:
13
January
2018
Abstract
A prediction of the current paradigm of the hierarchical assembly of galaxies is the presence of supermassive dual black holes at separations of a few kpc or less. In this context, we report the detection of a narrow-line emitter within the extended Lyα nebula (~120 kpc diameter) of the luminous radio-quiet quasi-stellar object (QSO) LBQS 0302–0019 at z = 3.286. We identify several high-ionization narrow emission lines (He II, C IV, C III) associated with this point-like source, which we have named “Jil”, which is only ~20 kpc (2.̋9) away from the QSO in projection. Emission-line diagnostics confirm that the source is likely powered by photoionization of an obscured active galactic nucleus (AGN) three orders of magnitude fainter than the QSO. The system represents the tightest unobscured/obscured dual AGN currently known at z > 3, highlighting the power of MUSE to detect these elusive systems.
Key words: Techniques: imaging spectroscopy / Ultraviolet: ISM / galaxies: high-redshift / quasars: individual: LBQS 0302–0019
© ESO 2018
1 Introduction
It has long been suggested that the circumgalactic medium (CGM) of QSOs may be detectable in emission via the H I Lyα line that is powered by recombination radiation, collisional excitation, and Lyα scattering (Rees 1988; Haiman & Rees 2001; Cantalupo et al. 2005; Kollmeier et al. 2010). Early narrow-band imaging and longslit spectroscopic surveys revealed extended (~100 kpc) Lyα nebulae almost exclusively around radio-loud 2 < z < 4 QSOs (e.g., Hu et al. 1991; Heckman et al. 1991), suggesting an origin in radio jets, as commonly observed in radio galaxies (e.g., McCarthy et al. 1990; Reuland et al. 2003; Humphrey et al. 2006; Villar-Martín et al. 2007). Subsequent surveys focusing on radio-quiet QSOs found smaller (≲70 kpc) and fainter (~10×) Lyα nebulae around ~50% of the targets (Christensen et al. 2006; North et al. 2012), but only recent campaigns have ubiquitously detected them and captured their diverse morphologies (e.g., Hennawi & Prochaska 2013; Borisova et al. 2016; Arrigoni Battaia et al. 2016).
Species other than hydrogen enable studies of the ionization conditions and the gas density. Extended He IIλ1640 and C IVλ1549 emission is common around radio galaxies and radio-loud QSOs (e.g., Villar-Martín et al. 2007), but only ~6% of the nebulae around radio-quiet QSOs show these lines (Borisova et al. 2016). In giant (300–460 kpc) Lyα nebulae, multiple AGN with separations of several tens of kpc have been discovered via isolated He II and metal lines (Cantalupo et al. 2014; Hennawi et al. 2015; Cai et al. 2017; Arrigoni Battaia et al. 2018).
In this Letter, we analyze the environment of the radio-quiet QSO LBQS 0302–0019 at z = 3.2859 (Shen 2016) that has been intensely targeted for studies of the intergalactic medium (IGM; e.g. Hu et al. 1995) and the impact of foreground galaxies and QSOs on the CGM and IGM (e.g., Steidel et al. 2003; Jakobsen et al. 2003; Tummuangpak et al. 2014; Schmidt et al. 2017). In particular, LBQS 0302–0019 is one of the few UV-transparent z > 3 sight lines that allow for Hubble Space Telescope UV spectroscopy of intergalactic He II Lyα absorption (e.g., Jakobsen et al. 1994; Syphers & Shull 2014). Here we discuss the detection of various high-ionization lines in its surrounding H I Lyα nebula, which shows that LBQS 0302–0019 is actually an unobscured/obscured dual AGN system with only 20 kpc projected separation.
We adopt a flat cosmology with Ωm = 0.3, ΩΛ = 0.7, and H0 = 70 km s−1 Mpc−1. The physical scale at z = 3.286 is 7.48 kpc arcsec−1.
2 Observations and results
2.1 Observations and data reduction
Observations of LBQS 0302–0019 were taken between October 2014 and January 2015 with the MUSE instrument (Bacon et al. 2010) at the Very Large Telescope. MUSE covers a ~1′ × 1′ field of view (FoV) with a sampling of 0.̋2 and spectral coverage from 4750 Å to 9300 Å at a spectral resolution of 1800 < R < 3600. The observations were split into 11 × 1450 s exposures subsequently rotated by 90∘ with some small dithering. The median seeing was ≃ 0.̋9. We reduced the data with the latest MUSE data reduction pipeline (v2.0.3. Weilbacher et al. 2012), which performs all major tasks,i.e., bias subtraction, wavelength calibration, flat-fielding,flux calibration based on photometric standards, and reconstruction of the data cube. While the sky-dominated regions of the FoV are used for an initial sky subtraction, prominent skyline residuals are further suppressed using our own PCA software (Husemann et al. 2016; Péroux et al. 2017). The deep reconstructed r-band image and the coadded spectrum of LBQS 0302–0019 are shown in the top panels of Fig. 1.
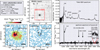 |
Fig. 1 Top panels: basic para meters of LBQS 0302–0019 as reported by Shen (2016) together with an r-band image reconstructed from the MUSE data and the QSO spectrum with marked emission lines. The red rectangle on the broad-band image indicates the zoom-in region in the lower panels. Bottom panels: continuum-subtracted narrow-band (Δ λ = 30 Å in observed-frame) images of Lyα and He IIλ1640 centered on the QSO position (green cross). For visualization, a Gaussian smoothing with a dispersion of one pixel has been applied to suppress the noise. A coadded spectrum from an aperture of 2′′ diameter centered on the bright emission-line source Jil is shown on the right. |
2.2 QSO subtraction and extended Lyα nebula
To study the extended nebular emission around bright QSOs it is crucial to subtract the point-like QSO emission that is smeared outdue to the seeing, as characterized by the point-spread function (PSF). Various studies have used empirical PSF estimates from the data as a function of wavelength (e.g., Christensen et al. 2006; Husemann et al. 2014; Herenz et al. 2015; Borisova et al. 2016). Here we follow the empirical method described in Borisova et al. (2016). We constructed a PSF from a median image (150 Å wide in the observed frame) at each monochromatic slice of the data cube, which is subsequently subtracted after matching the central 0.̋ 6 × 0.̋6. The subtraction of the QSO reveals a Lyα nebula witha maximum diameter of ≃ 16′′ (120 kpc) as shown in the bottom left panel of Fig. 1.
The Lyα flux integrated over an aperture of 8′′ radius is fLyα = 18.1 × 10⁻¹⁶ erg s−1 cm−2 which corresponds to a luminosity LLy α = 1.7 × 1044 erg s−1. The size and luminosity of this Lyα nebula are similar to those of other radio-quiet QSOs (Borisova et al. 2016). In this case the Lyα surface brightness distribution is asymmetric, with a bright knot about 2.9′′ (~20 kpc) northeast of the QSO. We refer to this source as Jil, Klingon for neighbor, with coordinates α = 03:04:50.03, δ = –00:08:12.5 (J2000), and a peak surface brightness of ΣLyα = 1.05 × 10⁻¹⁶ erg s−1 cm−2 arcsec−2.
2.3 Emission-line diagnostics and photoionization modeling
The coadded spectrum within a circular aperture of 1′′ radius around Jil is presented in the bottom right panel of Fig. 1. We clearly detect He II and C IVλλ1548, 1550 at >10σ significance. Coupling the kinematics to He II we also detect [C III] λ1907 and C III] λ1909 at 3σ significance. All lines are well fit with single Gaussian profiles whose parameters are listed in Table 1. Lyα is redshifted by 35 km s−1 (rest frame) compared to the other lines and also shows a significantly larger velocity dispersion after correcting for the wavelength-dependent spectral resolution of MUSE (Bacon et al. 2017). Both effects are likely caused by resonant scattering of Lyα photons.
At high redshifts, He II has mainly been detected around radio AGN (e.g., Heckman et al. 1991; Villar-Martín et al. 2007), and to date only a few dedicated searches have been performed to detect He II and C IV in the nebulae around radio-quiet QSOs (e.g., Arrigoni Battaia et al. 2015) and for bright high-redshift galaxies in the re-ionization era (e.g., Laporte et al. 2017). Borisova et al. (2016) detected He II at 2σ in 1 out of 17 nebulae around radio-quiet QSOs. Isolated He II emitters have been found within two of the four known giant Lyα nebulae, 71 and 86 kpc from the primary unobscured radio-quiet QSO (Hennawi et al. 2015; Arrigoni Battaia et al. 2018). The presence of an obscured AGN was invoked in both cases based on the narrow velocity width, the line ratios, and the compactness of the He II emitting region. In Fig. 2 we show He II/Lyα vs. C IV/Lyα and C IV/HeII vs. C III]/C IV for Jil in comparison to various individualnebulae of radio galaxies, unobscured QSOs, and obscured AGN. We also plot the line ratios of a composite spectrum of obscured AGN (Alexandroff et al. 2013). The nebular line ratios are inconsistent with the limits for radio-quiet QSOs obtained by Borisova et al. (2016), but agree with those of radio-loud QSOs and most obscured AGN. Due to the high He II surface brightness, we can derive proper line ratios in a matched aperture.
The detection of several lines allows us to explore ionization properties through a grid of photoionization models with the CLOUDY code (v10.01, Ferland et al. 2013) using the following assumptions and input parameters: (1) a power-law AGN spectral energy distribution fν ∝ ναν with αν = −1.7 at λrest < 912 Å (Lusso et al. 2015); (2) three different ionizing luminosities  ,
,  , and
, and  , where
  is estimated by scaling the Lusso et al. (2015) QSO template to the observed SDSS i-band magnitude of LBQS 0302–0019; (3) a plane-parallel geometry with an inner distance of 100 pc from the AGN; (4) a constant volume number density nH in the range 102–105 cm−3; (5) three different metallicities Z = 0.1 Z⊙, 0.5 Z⊙, and 1 Z⊙; (6) a column density NH determined by the stopping criterion of the calculations at T = 4000 K2. For each
  , the ionization parameter U ≡ Φ912∕(cnH) results from the nH variation, and ranges from −2 .6 ≲ log U ≲ 2 .4. Our parameter space is similar to works modeling narrow-line regions (NLRs) of obscured AGN (e.g., Groves et al. 2004; Nagao et al. 2006; Nakajima et al. 2018).
From the output of the CLOUDY calculations we extract the predictions for the relevant emission-line fluxes and the radius of the He II emitting region calculated as the ratio between the column density of He II and nH. In Fig. 2, we show the predictions of our photoionization models as a function of U for our three AGN luminosities and our three metallicities. We find that an obscured AGN with a luminosity 1000× fainter than the QSO is sufficient to produce the observed He II luminosity within an emitting region of RHe < 200 pc. Our simple models cover the region defined by the observed line ratios, implying Z < Z⊙ for the gas around the obscured AGN. At fixed metallicity, models with different  yielding the same U parameter are expected to give very similar results (Fig. 2).
Emission-line measurements for the source Jil.
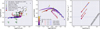 |
Fig. 2 Emission-line diagnostics and photoionization modeling of Jil’s spectrum. In all panels we show CLOUDY (Ferland et al. 2013) photoionization model results for an obscured AGN with three different fractions of the LBQS 0302–0019 UV luminosity, three metallicities, and a range of ionization parameters U as indicated in the legend and color bar of the middle panel. Left: He II/Lyα vs. C IV/Lyα of Jil 20 kpc from LBQS 0302–0019 (red filled circle) in comparison to various measurements of other Lyα nebulae around QSOs, radio galaxies, and obscured AGN at z > 2 (see legend). Middle: C IV/He II vs. C III/C IV diagnostic diagram with symbols as in the left panel. Right: ratio of observed to predicted He II luminosity as a function of the radius of a He II emitting sphere. Illumination by LBQS 0302–0019 results in the black solid line. |
2.4 Intrinsic vs. external AGN ionization source
Although an obscured AGN appears to be able to power Jil, we also checked whether the QSO can power the emission. We tested this hypothesis by comparing LHe with the incident He II-ionizing flux 20 kpc from the QSO intercepted by a homogeneously filled sphere of radius RHe. Scaling the Lusso et al. (2015) broken power-law spectrum to the dereddened SDSS i-band magnitud emi =17.34 mag leads to an extrapolated absolute monochromatic magnitude at the He II edge of M228 = −25.78 mag. This corresponds to a photon flux of Φ(He+) = 1.85 × 10¹⁰ photons s−1 cm−2 at a distance of 20 kpc. Assuming that every emitted He II λ1640 photon requires at least one He II-ionizing photon, we can predict the maximum number of emitted He II λ1640 photons from a sphere with radius  , where we assumed case B recombination and that all incident ionizing photons passing through the sphere are absorbed.
The results of this computation are shown in the right panel of Fig. 2, indicating RHe II ≳ 1 kpc. This size of the He II emitting region is a hard lower limit given our simple and very conservative assumption for the QSO ionization scenario. A diameter of >2 kpc would correspond to >0.̋3 projected on the sky. This size is borderline consistent with the observations at our spatial resolution. A low-luminosity obscured AGN is sufficient to power the observed compact He II emission with a much smaller RHe II, and we do not detect He II even coadding the rest of the larger Lyα nebula. We argue that the embedded obscured AGN scenario is much more likely also considering the asymmetry of the nebula. This scenario would naturally explain the Lyα velocity shift due to scattering in the NLR a few 100 pc away from a highly dust-obscured source, which would not be the case if directly illuminated by the QSO. Hence, LBQS 0302–0019 and Jil form a close dual AGN system with 20 kpc projected separation.
3 Discussion
At low redshifts (z < 1) numerous dual AGN with kpc-scale separation have been identified through high-resolution X-ray imaging with Chandra (e.g., Koss et al. 2012) or through radio interferometry (e.g., Fu et al. 2015; Müller-Sánchez et al. 2015). Both methods probe the core emission and are robust in detecting AGN. However, the sensitivity of Chandra is limited and radio-jets can mimic dual AGN signatures in the radio, which makes the methods difficult to apply at high redshifts. Alternatively, the high-ionization [O III] λλ4960, 5007 lines of the NLR have been employed to search for dual AGN. In particular, double-peaked [O III] emitters were considered a parent sample for dual AGN candidates (e.g., Liu et al. 2010), but spatially resolved spectroscopy revealed that rotating disks, AGN outflow, jet-cloud interactions are the origin of the double-peaked lines in most cases (e.g., Fu et al. 2012; Nevin et al. 2016). The most robust kpc-scale dual AGN systems are always associated with the nuclei of two merging galaxies that are spatially coincident with AGN signature from the NLR (e.g., Woo et al. 2014), from X-rays (e.g., Liu et al. 2013; Ellison et al. 2017), or from radio cores (e.g., Müller-Sánchez et al. 2015).
Multiple AGN systems at high redshifts are mainly identified as independent bright QSOs in large imaging and spectroscopic surveys (e.g., Hennawi et al. 2006; Myers et al. 2008). While most of the known nearby QSOs have separations of several 100 kpc, a few dual QSOs at ~10 kpc are identified in the redshift range 0.5 < z < 2.5 Gregg et al. (2002); Pindor et al. (2006); Hennawi et al. (2006); Eftekharzadeh et al. (2017), and only one QSO pair with <20 kpc separation was reported at z > 3 by Hennawi et al. (2010). Overall the statistics for QSOs at high redshift indicates an excess of QSO clustering at very small separations (e.g., Hennawi et al. 2006; Myers et al. 2007). This is somewhat expected as the rapid growth of massive SMBH in the early Universe is related to overdensities as inferred from QSO clustering studies (e.g., Shen et al. 2007). While the prevalence of AGN in major galaxy mergers is highly controversial at low and intermediate redshifts (e.g., Cisternas et al. 2011; Treister et al. 2012; Villforth et al. 2017), the role of major mergers for BH growth may be more important at early cosmic times z > 3.
In case major mergers at high redshifts are more prevalent in triggering AGN, it is possible that many close dual AGN are currently missed because AGN in gas-rich major mergers may often be highly obscured (e.g., Kocevski et al. 2015; Ricci et al. 2017). To detect close dual AGN with at least one obscured companion is challenging at high redshift given the lack of spatial resolution and sensitivity at hard X-rays, and the limited diagnostic power of optical emission lines due to an increasing ionization parameter in high-redshift galaxies (e.g., Kewley et al. 2013). Instead, the sensitivity of MUSE allows us to detect the rest-frame far-UV high-ionization emission lines of AGN from which already several obscured AGN at >50 kpc were identified in giant Lyα nebulae around bright QSOs at z > 2 (e.g., Hennawi et al. 2015; Arrigoni Battaia et al. 2018) and around the radio-loud QSO PKS 1614+051 (Djorgovski et al. 1985; Husband et al. 2015). Our dual AGN system is detected with the same method, but at a much smaller projected separation of 20 kpc, which is already in a regime where the PSF of the bright QSO needs to be subtracted properly for a detection. In the dual AGN scenario we expect two strongly interacting massive host galaxies to be associated with the two nuclei. This major merger scenario is testable with deep high-resolution rest-frame optical imaging with Hubble and mapping the molecular gas at high angular resolution with ALMA in the sub-mm.
4 Conclusions
We report the detection of a He II emission-line source, named Jil, at z = 3.28 that is close to the luminous radio-quiet QSO LBQS 0302–0019. Based on emission-line ratio diagnostics we verified that Jil is ionized most likely by an embedded obscured AGN. With a projected separation of only ~20 kpc to the QSO, this system represents the tightest unobscured/obscured dual AGN system reported at z > 3.
High-redshift rest-frame far-UV line diagnostics supersede the classical rest-frame optical line ratios when Hα is shifted out of the K band at z > 3. Furthermore, current X-ray observatories lack the sensitivity and spatial resolution to systematically detect small separation obscured dual AGN at high redshifts. Hence, VLT-MUSE is the ideal instrument to look for tight dual AGN candidates at high-redshift that would be missed otherwise. The ground-layer adaptive optics system of MUSE will further enhance the detectability of these dual AGN, due to a significant increase in spatial resolution and point-source sensitivity.
References
- Alexandroff, R., Strauss, M. A., Greene, J. E., et al. 2013, MNRAS, 435, 3306 [NASA ADS] [CrossRef] [Google Scholar]
- Arrigoni Battaia, F., Hennawi, J. F., Prochaska, J. X., & Cantalupo, S. 2015, ApJ, 809, 163 [NASA ADS] [CrossRef] [Google Scholar]
- Arrigoni Battaia, F., Hennawi, J. F., Cantalupo, S., & Prochaska, J. X. 2016, ApJ, 829, 3 [NASA ADS] [CrossRef] [Google Scholar]
- Arrigoni Battaia, F., Prochaska, J. X., Hennawi, J. F., et al. 2018, MNRAS, 473, 3907 [NASA ADS] [CrossRef] [Google Scholar]
- Bacon, R., Accardo, M., Adjali, L., et al. 2010, SPIE Conf. Ser., 7735, 8 [Google Scholar]
- Bacon, R., Conseil, S., Mary, D., et al. 2017, A&A, 608, A1 [NASA ADS] [CrossRef] [EDP Sciences] [Google Scholar]
- Borisova, E., Cantalupo, S., Lilly, S. J., et al. 2016, ApJ, 831, 39 [NASA ADS] [CrossRef] [Google Scholar]
- Cai, Z., Fan, X., Yang, Y., et al. 2017, ApJ, 837, 71 [NASA ADS] [CrossRef] [Google Scholar]
- Cantalupo, S., Porciani, C., Lilly, S. J., & Miniati, F. 2005, ApJ, 628, 61 [NASA ADS] [CrossRef] [Google Scholar]
- Cantalupo, S., Arrigoni-Battaia, F., Prochaska, J. X., Hennawi, J. F., & Madau, P. 2014, Nature, 506, 63 [NASA ADS] [CrossRef] [Google Scholar]
- Christensen, L., Jahnke, K., Wisotzki, L., & Sánchez, S. F. 2006, A&A, 459, 717 [NASA ADS] [CrossRef] [EDP Sciences] [Google Scholar]
- Cisternas, M., Jahnke, K., Inskip, K. J., et al. 2011, ApJ, 726, 57 [NASA ADS] [CrossRef] [Google Scholar]
- Djorgovski, S., Spinrad, H., McCarthy, P., & Strauss, M. A. 1985, ApJ, 299, L1 [NASA ADS] [CrossRef] [Google Scholar]
- Eftekharzadeh, S., Myers, A. D., Hennawi, J. F., et al. 2017, MNRAS, 468, 77 [NASA ADS] [CrossRef] [Google Scholar]
- Ellison, S. L., Secrest, N. J., Mendel, J. T., Satyapal, S., & Simard, L. 2017, MNRAS, 470, L49 [NASA ADS] [CrossRef] [Google Scholar]
- Ferland, G. J., Porter, R. L., van Hoof, P. A. M., et al. 2013, Rev. Mex. Astron. Astrofis., 49, 137 [Google Scholar]
- Fu, H., Yan, L., Myers, A. D., et al. 2012, ApJ, 745, 67 [Google Scholar]
- Fu, H., Myers, A. D., Djorgovski, S. G., et al. 2015, ApJ, 799, 72 [NASA ADS] [CrossRef] [Google Scholar]
- Gregg, M. D., Becker, R. H., White, R. L., et al. 2002, ApJ, 573, L85 [NASA ADS] [CrossRef] [Google Scholar]
- Groves, B. A., Dopita, M. A., & Sutherland, R. S. 2004, ApJS, 153, 9 [NASA ADS] [CrossRef] [Google Scholar]
- Haiman, Z., & Rees, M. J. 2001, ApJ, 556, 87 [NASA ADS] [CrossRef] [Google Scholar]
- Heckman, T. M., Miley, G. K., Lehnert, M. D., & van Breugel W. 1991, ApJ, 370, 78 [NASA ADS] [CrossRef] [Google Scholar]
- Hennawi, J. F., & Prochaska, J. X. 2013, ApJ, 766, 58 [NASA ADS] [CrossRef] [Google Scholar]
- Hennawi, J. F., Strauss, M. A., Oguri, M., et al. 2006, AJ, 131, 1 [NASA ADS] [CrossRef] [Google Scholar]
- Hennawi, J. F., Myers, A. D., Shen, Y., et al. 2010, ApJ, 719, 1672 [NASA ADS] [CrossRef] [Google Scholar]
- Hennawi, J. F., Prochaska, J. X., Cantalupo, S., & Arrigoni-Battaia, F. 2015, Science, 348, 779 [NASA ADS] [CrossRef] [PubMed] [Google Scholar]
- Herenz, E. C., Wisotzki, L., Roth, M., & Anders, F. 2015, A&A, 576, A115 [NASA ADS] [CrossRef] [EDP Sciences] [Google Scholar]
- Hu, E. M., Songaila, A., Cowie, L. L., & Stockton, A. 1991, ApJ, 368, 28 [NASA ADS] [CrossRef] [Google Scholar]
- Hu, E. M., Kim, T.-S., Cowie, L. L., Songaila, A., & Rauch, M. 1995, AJ, 110, 1526 [NASA ADS] [CrossRef] [Google Scholar]
- Humphrey, A., Villar-Martín, M., Fosbury, R., Vernet, J., & di Serego Alighieri S. 2006, MNRAS, 369, 1103 [NASA ADS] [CrossRef] [Google Scholar]
- Husband, K., Bremer, M. N., Stanway, E. R., & Lehnert, M. D. 2015, MNRAS, 452, 2388 [NASA ADS] [CrossRef] [Google Scholar]
- Husemann, B., Jahnke, K., Sánchez, S. F., et al. 2014, MNRAS, 443, 755 [NASA ADS] [CrossRef] [Google Scholar]
- Husemann, B., Bennert, V. N., Scharwächter, J., Woo, J.-H., & Choudhury, O. S. 2016, MNRAS, 455, 1905 [NASA ADS] [CrossRef] [Google Scholar]
- Jakobsen, P., Boksenberg, A., Deharveng, J. M., et al. 1994, Nature, 370, 35 [NASA ADS] [CrossRef] [Google Scholar]
- Jakobsen, P., Jansen, R. A., Wagner, S., & Reimers, D. 2003, A&A, 397, 891 [NASA ADS] [CrossRef] [EDP Sciences] [Google Scholar]
- Kewley, L. J., Maier, C., Yabe, K., et al. 2013, ApJ, 774, L10 [Google Scholar]
- Kocevski, D. D., Brightman, M., Nandra, K., et al. 2015, ApJ, 814, 104 [NASA ADS] [CrossRef] [EDP Sciences] [Google Scholar]
- Kollmeier, J. A., Zheng, Z., Davé, R., et al. 2010, ApJ, 708, 1048 [NASA ADS] [CrossRef] [Google Scholar]
- Koss, M., Mushotzky, R., Treister, E., et al. 2012, ApJ, 746, L22 [NASA ADS] [CrossRef] [Google Scholar]
- Laporte, N., Nakajima, K., Ellis, R. S., et al. 2017, ApJ, 851, 40 [NASA ADS] [CrossRef] [Google Scholar]
- Liu, X., Shen, Y., Strauss, M. A., & Greene, J. E. 2010, ApJ, 708, 427 [NASA ADS] [CrossRef] [Google Scholar]
- Liu, X., Civano, F., Shen, Y., et al. 2013, ApJ, 762, 110 [NASA ADS] [CrossRef] [Google Scholar]
- Lusso, E., Worseck, G., Hennawi, J. F., et al. 2015, MNRAS, 449, 4204 [NASA ADS] [CrossRef] [Google Scholar]
- McCarthy, P. J., Spinrad, H., Dickinson, M., et al. 1990, ApJ, 365, 487 [NASA ADS] [CrossRef] [Google Scholar]
- Müller-Sánchez, F., Comerford, J. M., Nevin, R., et al. 2015, ApJ, 813, 103 [NASA ADS] [CrossRef] [Google Scholar]
- Myers, A. D., Brunner, R. J., Richards, G. T., et al. 2007, ApJ, 658, 99 [NASA ADS] [CrossRef] [Google Scholar]
- Myers, A. D., Richards, G. T., Brunner, R. J., et al. 2008, ApJ, 678, 635 [NASA ADS] [CrossRef] [Google Scholar]
- Nagao, T., Marconi, A., & Maiolino, R. 2006, A&A, 447, 157 [NASA ADS] [CrossRef] [EDP Sciences] [Google Scholar]
- Nakajima, K., Schaerer, D., Le Fevre, O., et al. 2018, A&A, in press, DOI: 10.1051/0004-6361/201731935 [Google Scholar]
- Nevin, R., Comerford, J., Müller-Sánchez, F., Barrows, R., & Cooper, M. 2016, ApJ, 832, 67 [NASA ADS] [CrossRef] [Google Scholar]
- North, P. L., Courbin, F., Eigenbrod, A., & Chelouche, D. 2012, A&A, 542, A91 [NASA ADS] [CrossRef] [EDP Sciences] [Google Scholar]
- Péroux, C., Rahmani, H., Quiret, S., et al. 2017, MNRAS, 464, 2053 [NASA ADS] [CrossRef] [Google Scholar]
- Pindor, B., Eisenstein, D. J., Gregg, M. D., et al. 2006, AJ, 131, 41 [NASA ADS] [CrossRef] [Google Scholar]
- Rees, M. J. 1988, Nature, 333, 523 [NASA ADS] [CrossRef] [Google Scholar]
- Reuland, M., van Breugel, W., Röttgering, H., et al. 2003, ApJ, 592, 755 [NASA ADS] [CrossRef] [Google Scholar]
- Ricci, C., Bauer, F. E., Treister, E., et al. 2017, MNRAS, 468, 1273 [NASA ADS] [Google Scholar]
- Schmidt, T. M., Worseck, G., Hennawi, J. F., Prochaska, J. X., & Crighton, N. H. M. 2017, ApJ, 847, 81 [NASA ADS] [CrossRef] [Google Scholar]
- Shen, Y. 2016, ApJ, 817, 55 [NASA ADS] [CrossRef] [Google Scholar]
- Shen, Y., Strauss, M. A., Oguri, M., et al. 2007, AJ, 133, 2222 [NASA ADS] [CrossRef] [Google Scholar]
- Steidel, C. C., Adelberger, K. L., Shapley, A. E., et al. 2003, ApJ, 592, 728 [NASA ADS] [CrossRef] [Google Scholar]
- Syphers, D., & Shull, J. M. 2014, ApJ, 784, 42 [NASA ADS] [CrossRef] [Google Scholar]
- Treister, E., Schawinski, K., Urry, C. M., & Simmons, B. D. 2012, ApJ, 758, L39 [NASA ADS] [CrossRef] [Google Scholar]
- Tummuangpak, P., Bielby, R. M., Shanks, T., et al. 2014, MNRAS, 442, 2094 [NASA ADS] [CrossRef] [Google Scholar]
- Villar-Martín, M., Sánchez, S. F., Humphrey, A., et al. 2007, MNRAS, 378, 416 [NASA ADS] [CrossRef] [Google Scholar]
- Villforth, C., Hamilton, T., Pawlik, M. M., et al. 2017, MNRAS, 466, 812 [NASA ADS] [CrossRef] [Google Scholar]
- Weilbacher, P. M., Streicher, O., Urrutia, T., et al. 2012, SPIE Conf. Ser., 8451 [Google Scholar]
- Woo, J.-H., Cho, H., Husemann, B., et al. 2014, MNRAS, 437, 32 [NASA ADS] [CrossRef] [Google Scholar]
For the predictions of interest we found similar results for calculations with a stopping threshold of T = 100 K.
All Tables
All Figures
|
Fig. 1 Top panels: basic para meters of LBQS 0302–0019 as reported by Shen (2016) together with an r-band image reconstructed from the MUSE data and the QSO spectrum with marked emission lines. The red rectangle on the broad-band image indicates the zoom-in region in the lower panels. Bottom panels: continuum-subtracted narrow-band (Δ λ = 30 Å in observed-frame) images of Lyα and He IIλ1640 centered on the QSO position (green cross). For visualization, a Gaussian smoothing with a dispersion of one pixel has been applied to suppress the noise. A coadded spectrum from an aperture of 2′′ diameter centered on the bright emission-line source Jil is shown on the right. |
| In the text | |
|
Fig. 2 Emission-line diagnostics and photoionization modeling of Jil’s spectrum. In all panels we show CLOUDY (Ferland et al. 2013) photoionization model results for an obscured AGN with three different fractions of the LBQS 0302–0019 UV luminosity, three metallicities, and a range of ionization parameters U as indicated in the legend and color bar of the middle panel. Left: He II/Lyα vs. C IV/Lyα of Jil 20 kpc from LBQS 0302–0019 (red filled circle) in comparison to various measurements of other Lyα nebulae around QSOs, radio galaxies, and obscured AGN at z > 2 (see legend). Middle: C IV/He II vs. C III/C IV diagnostic diagram with symbols as in the left panel. Right: ratio of observed to predicted He II luminosity as a function of the radius of a He II emitting sphere. Illumination by LBQS 0302–0019 results in the black solid line. |
| In the text | |
Current usage metrics show cumulative count of Article Views (full-text article views including HTML views, PDF and ePub downloads, according to the available data) and Abstracts Views on Vision4Press platform.
Data correspond to usage on the plateform after 2015. The current usage metrics is available 48-96 hours after online publication and is updated daily on week days.
Initial download of the metrics may take a while.