Free Access
Fig. 4
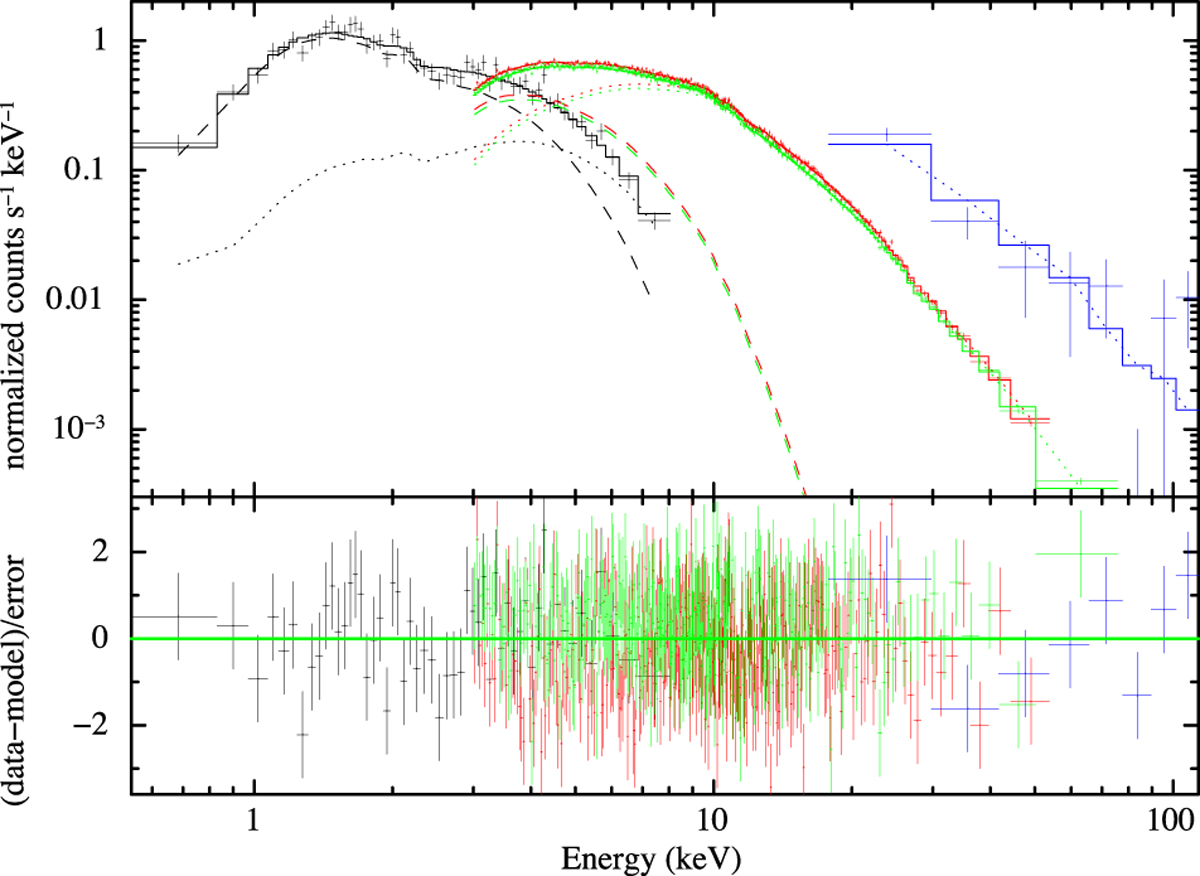
Broad-band spectrum of IGR J16597–3704 (Swift in black, NuSTAR FPMA (FPMB) in red (green), and IBIS/ISGRI in blue). The dashed and dotted lines represent the disk-blackbody and comptonisation components of our model, respectively.
Current usage metrics show cumulative count of Article Views (full-text article views including HTML views, PDF and ePub downloads, according to the available data) and Abstracts Views on Vision4Press platform.
Data correspond to usage on the plateform after 2015. The current usage metrics is available 48-96 hours after online publication and is updated daily on week days.
Initial download of the metrics may take a while.