Free Access
Fig. 3
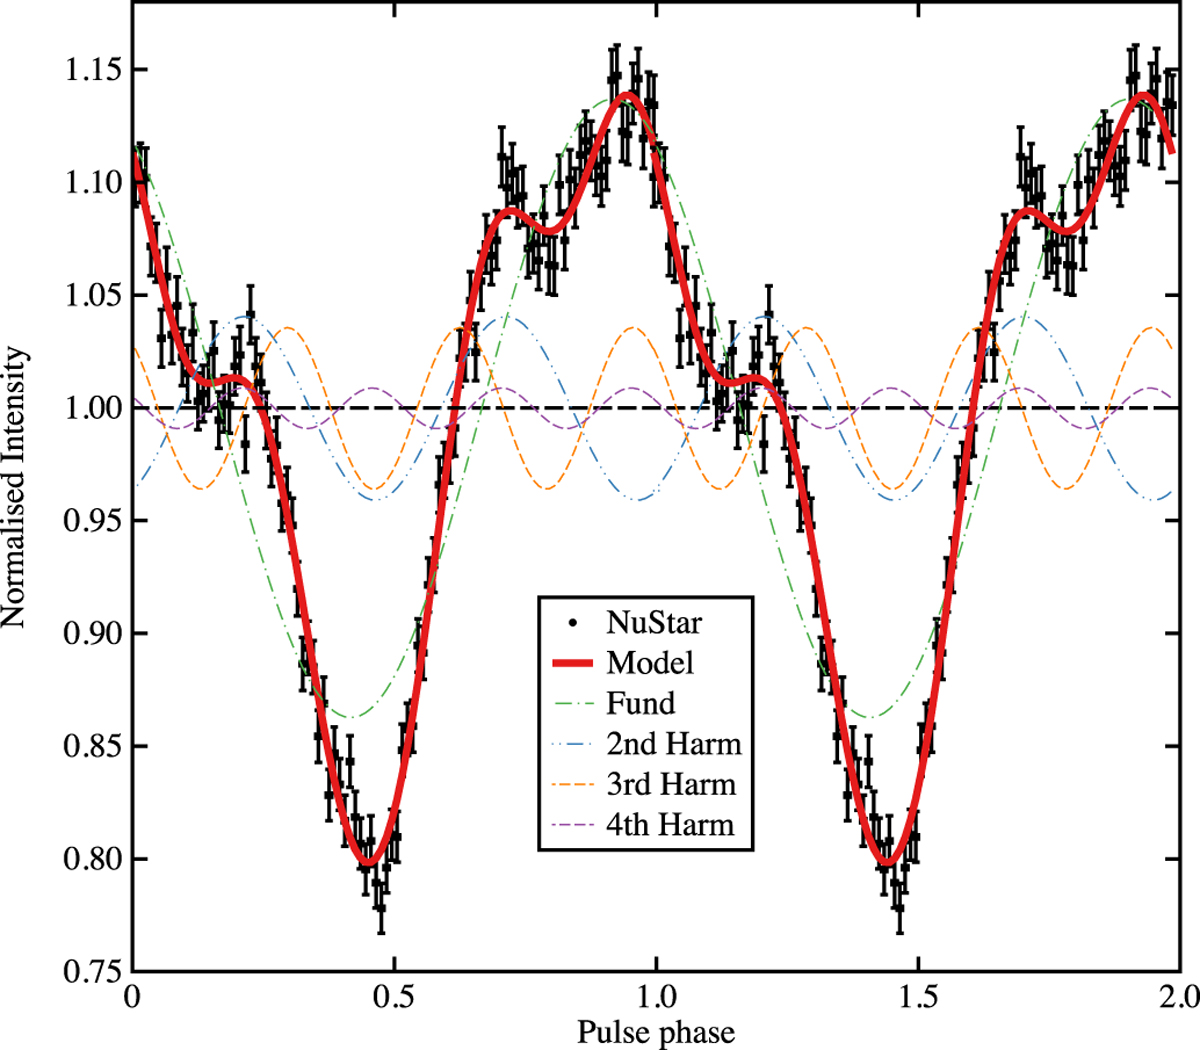
Pulse profile (black points) obtained from the epoch-folded NuSTAR data. The best-fit model obtained by combining four sinusoids with harmonically related periods is also shown (red line). Two cycles of the pulse profile are shown for clarity.
Current usage metrics show cumulative count of Article Views (full-text article views including HTML views, PDF and ePub downloads, according to the available data) and Abstracts Views on Vision4Press platform.
Data correspond to usage on the plateform after 2015. The current usage metrics is available 48-96 hours after online publication and is updated daily on week days.
Initial download of the metrics may take a while.