Fig. 5
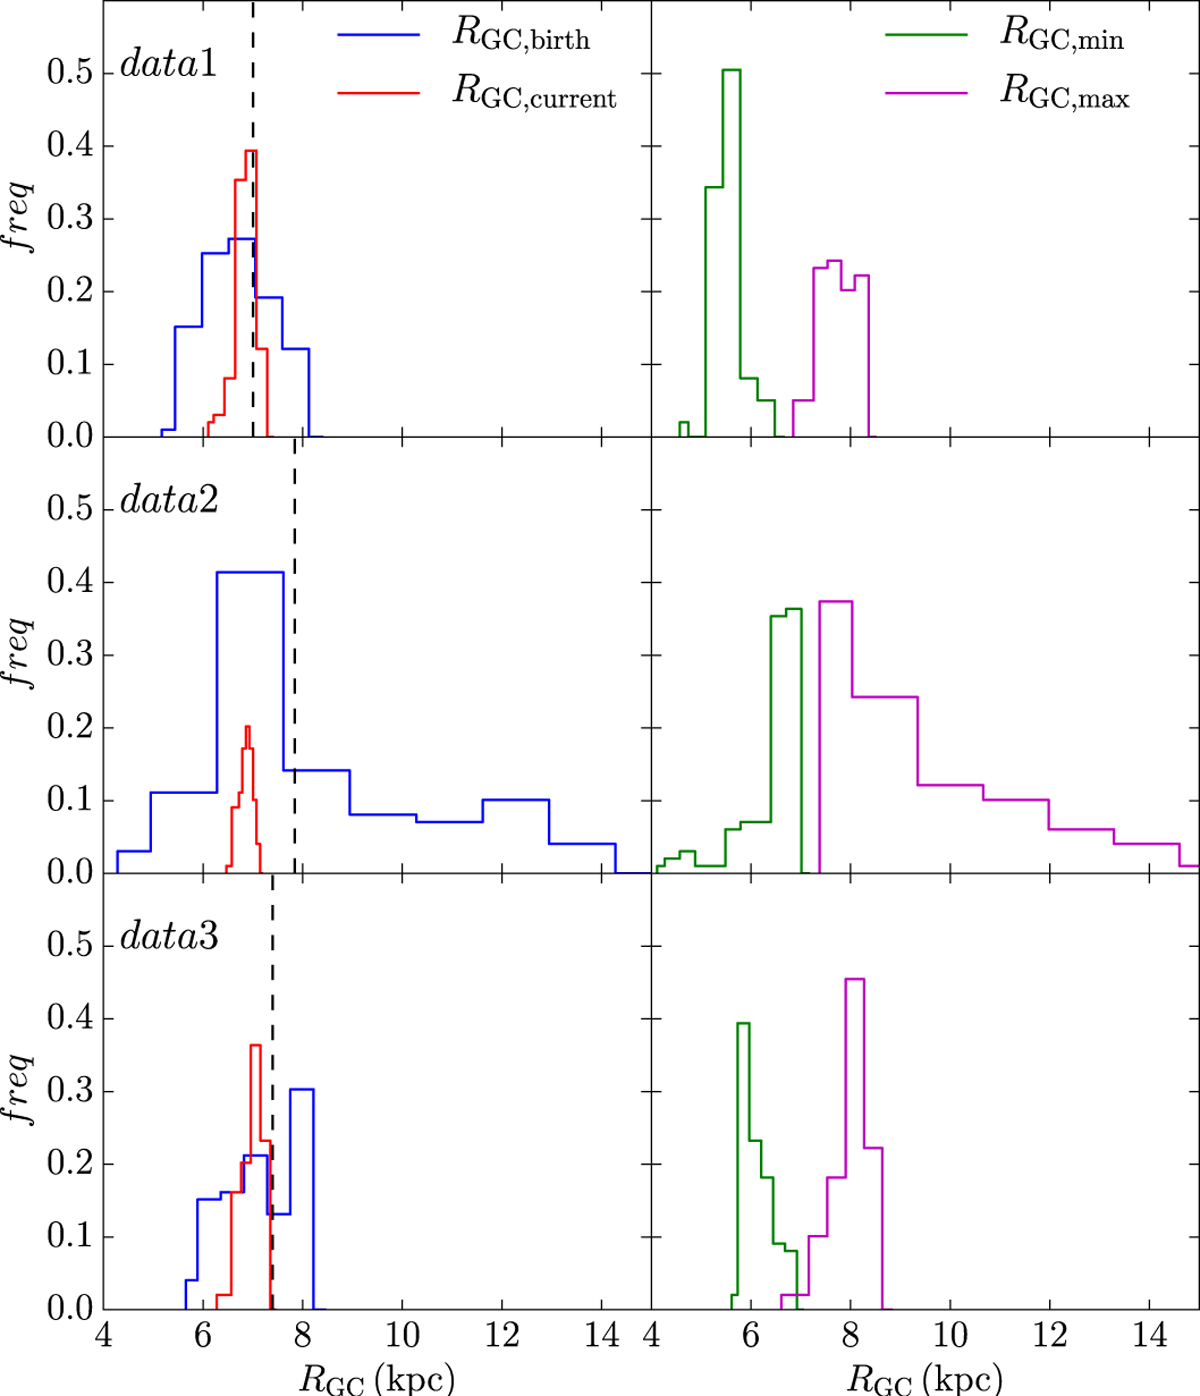
Distributions of current and birth radii (left), and the maximum and minimum orbit radius (right), given by 100 realizations of the one of the models of the gravitational potential (see text). Each row shows the results for the three datasets specified in Table 8. The median birth radius is indicated with a dashed vertical line.
Current usage metrics show cumulative count of Article Views (full-text article views including HTML views, PDF and ePub downloads, according to the available data) and Abstracts Views on Vision4Press platform.
Data correspond to usage on the plateform after 2015. The current usage metrics is available 48-96 hours after online publication and is updated daily on week days.
Initial download of the metrics may take a while.