Fig. 4
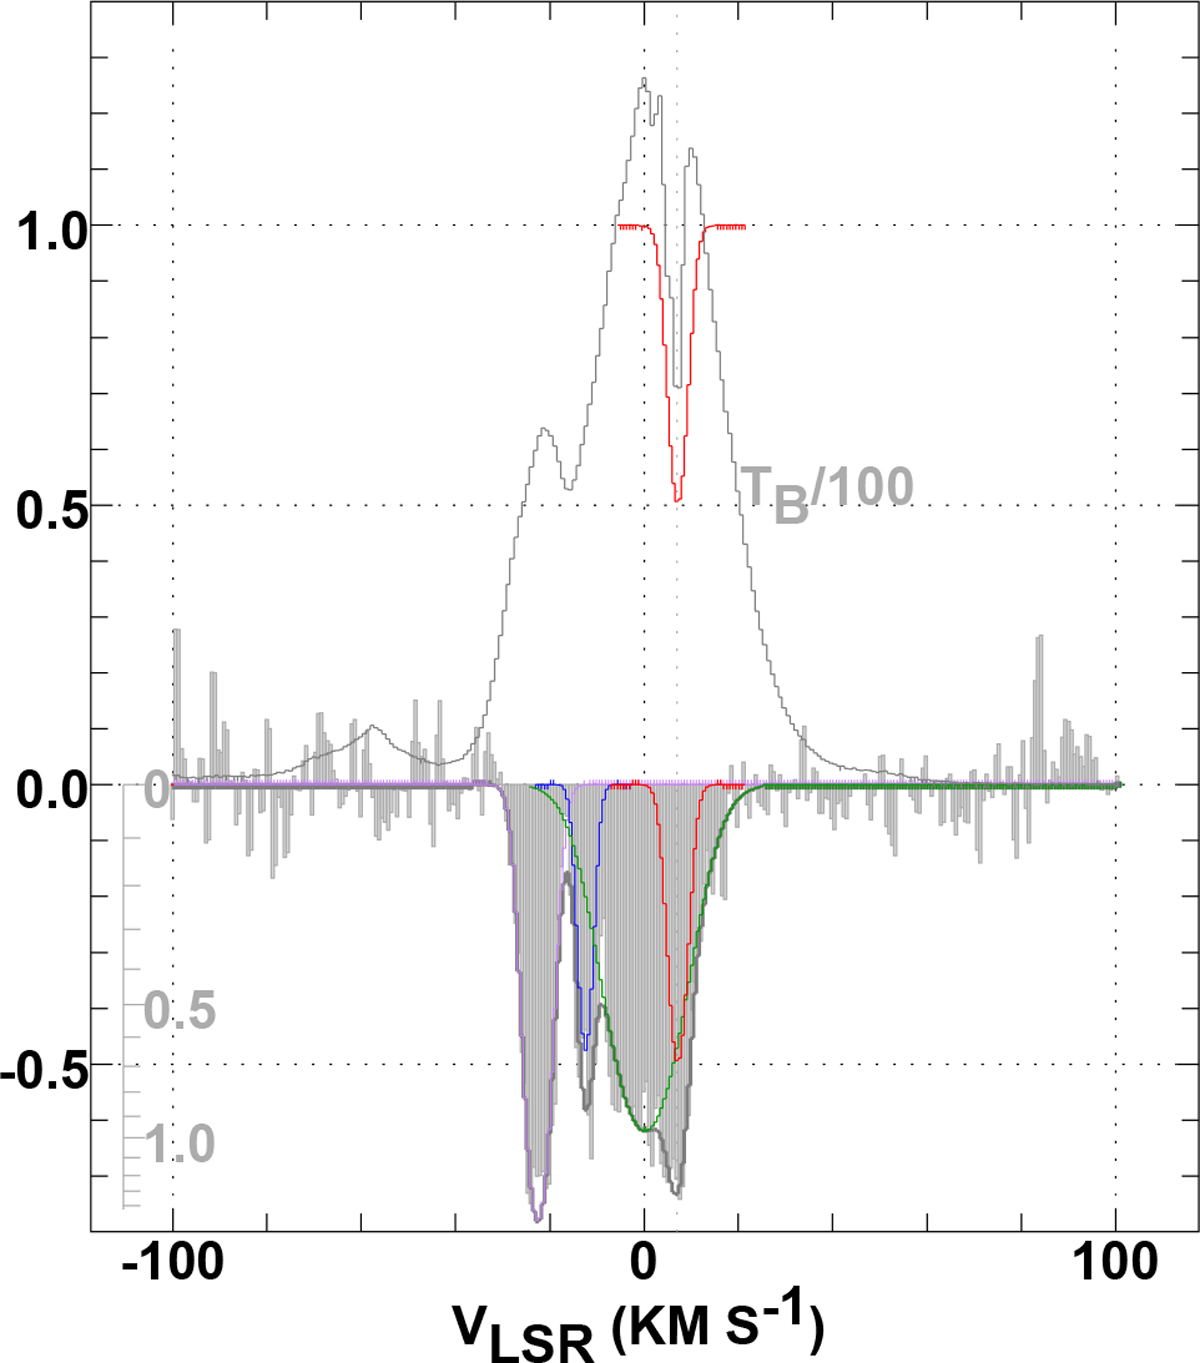
λ21 cm H I emission, absorption and self-absorption toward J1744. Bottom: Gaussian decomposition of the H I absorption profile of Dickey et al. (1983, see Table 3). An optical depth scale is shown inset. Top: GASS III H I emission scaled down by a factor 100, with one component of the Gaussian decomposition shown superposed to show coincidence between the H I absorption and self-absorption.
Current usage metrics show cumulative count of Article Views (full-text article views including HTML views, PDF and ePub downloads, according to the available data) and Abstracts Views on Vision4Press platform.
Data correspond to usage on the plateform after 2015. The current usage metrics is available 48-96 hours after online publication and is updated daily on week days.
Initial download of the metrics may take a while.