Fig. 8
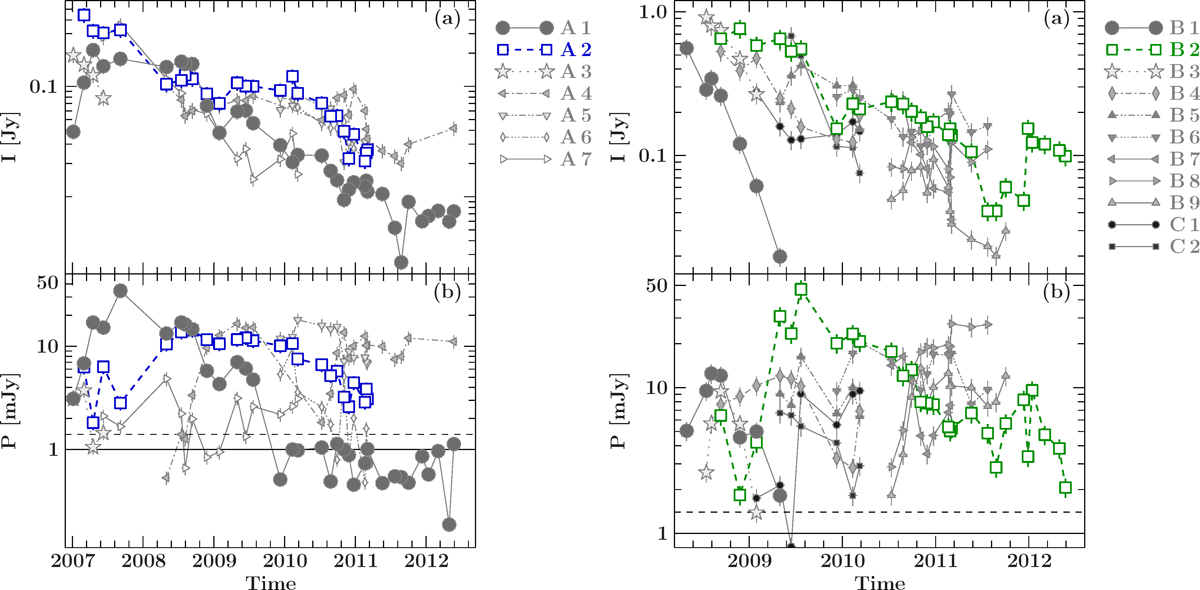
Evolution of the total (panels a) and polarized flux density (panels b) for selected components of group A and B. For all components the total flux decreases with time. Components identified as trailing components are held in gray. The 2σ (3σ) thresholds for polarized components to be considered in Figs. 5 and 7 are denoted as solid (dashed) black lines.
Current usage metrics show cumulative count of Article Views (full-text article views including HTML views, PDF and ePub downloads, according to the available data) and Abstracts Views on Vision4Press platform.
Data correspond to usage on the plateform after 2015. The current usage metrics is available 48-96 hours after online publication and is updated daily on week days.
Initial download of the metrics may take a while.