Fig. 6
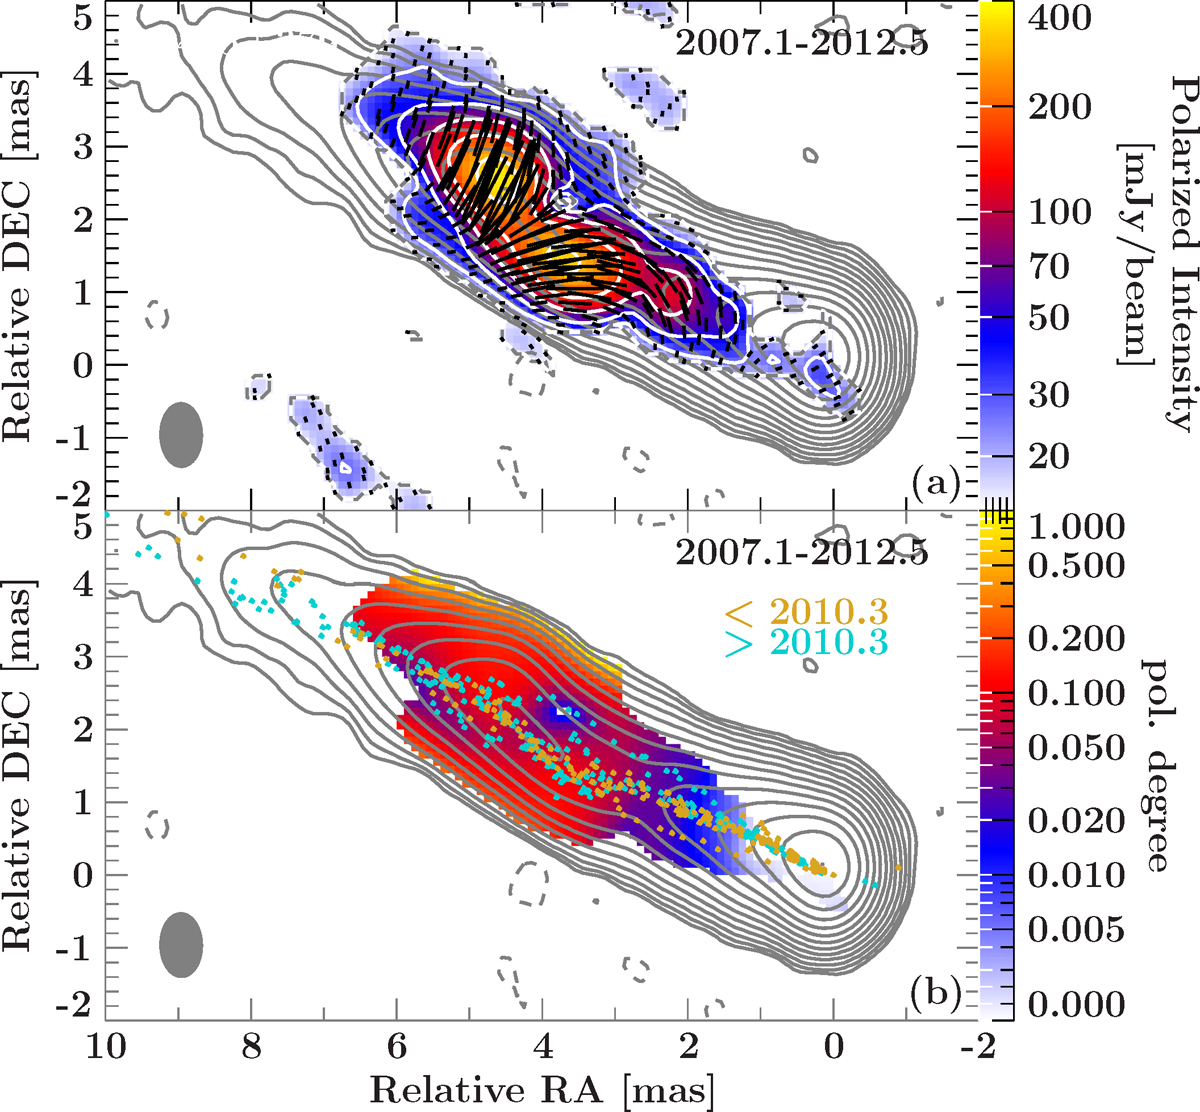
Stacked images with polarimetry information for all involved epochs from early 2007.1 until mid 2012.5. We first stack the maps of the channels Q and U and then combine those to derive the shown maps. Panel a: color-coded distribution of the polarized intensity with overlaid EVPAs on top of total intensity contours in gray. White contours correspond to the polarized intensity. Panel b: distribution of the degree of polarization and overlaid Gaussian (total intensity) model components color-coded for components occurring before and after 2010.3 in orange and blue, respectively.
Current usage metrics show cumulative count of Article Views (full-text article views including HTML views, PDF and ePub downloads, according to the available data) and Abstracts Views on Vision4Press platform.
Data correspond to usage on the plateform after 2015. The current usage metrics is available 48-96 hours after online publication and is updated daily on week days.
Initial download of the metrics may take a while.