Fig. 4
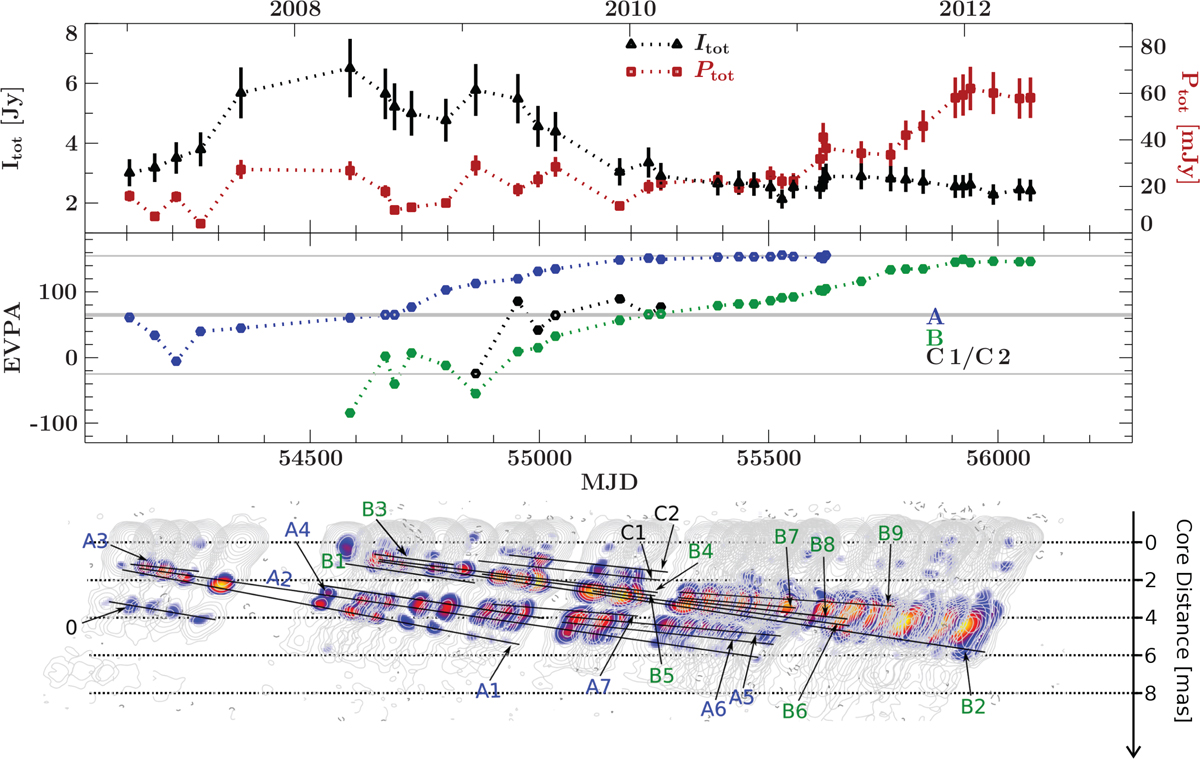
Top panel: MOJAVE light curve with the total flux density (black triangles, for the most significant total flux density, 5σ above the background) and the total polarized flux density (dark red squares, integrating the flux densities of all model components with at least 1.4 mJy, which corresponds to the average baseline polarized flux density at 3σ above the background); middle panel: temporal evolution of the EVPAs of the polarized features A (blue), B (green), and C (black). The solid gray line at ~63° corresponds to the jet position angle derived from the average angle followed by all tracked components. The two thin gray lines at 63°–90° and 63°+90° mark anglesperpendicular to the jet axis. The EVPAs are flux-weighted averages for the corresponding feature; bottom panel: total intensity contours with overlaid color-coded maps of polarized intensity as shown in Fig. 3. Polarized model components forming the two main polarized features A and B and their near-ballistic trajectories are shown on top of the maps. Components that contribute to the extended most downstream polarized region of feature B but where no consistent kinematic model can be found are not labeled.
Current usage metrics show cumulative count of Article Views (full-text article views including HTML views, PDF and ePub downloads, according to the available data) and Abstracts Views on Vision4Press platform.
Data correspond to usage on the plateform after 2015. The current usage metrics is available 48-96 hours after online publication and is updated daily on week days.
Initial download of the metrics may take a while.