Free Access
Fig. 2
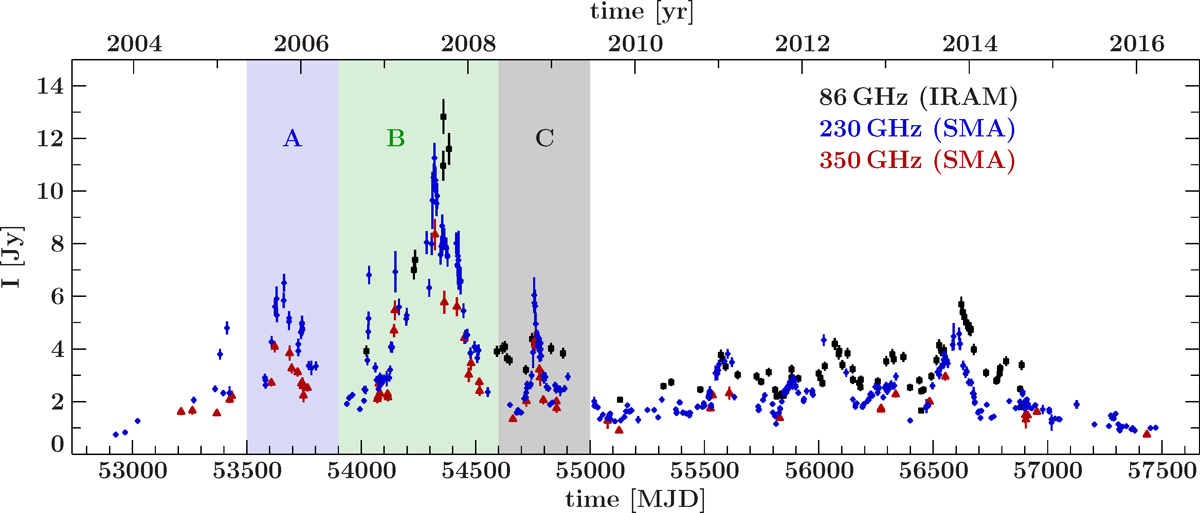
Millimeter light curves of 3C 111 at 86 GHz (IRAM, black squares), 230 GHz, and 350 GHz (SMA, blue diamonds and dark-red triangles, respectively). The shaded regions mark the three major outbursts A–C.
Current usage metrics show cumulative count of Article Views (full-text article views including HTML views, PDF and ePub downloads, according to the available data) and Abstracts Views on Vision4Press platform.
Data correspond to usage on the plateform after 2015. The current usage metrics is available 48-96 hours after online publication and is updated daily on week days.
Initial download of the metrics may take a while.