Fig. C.2
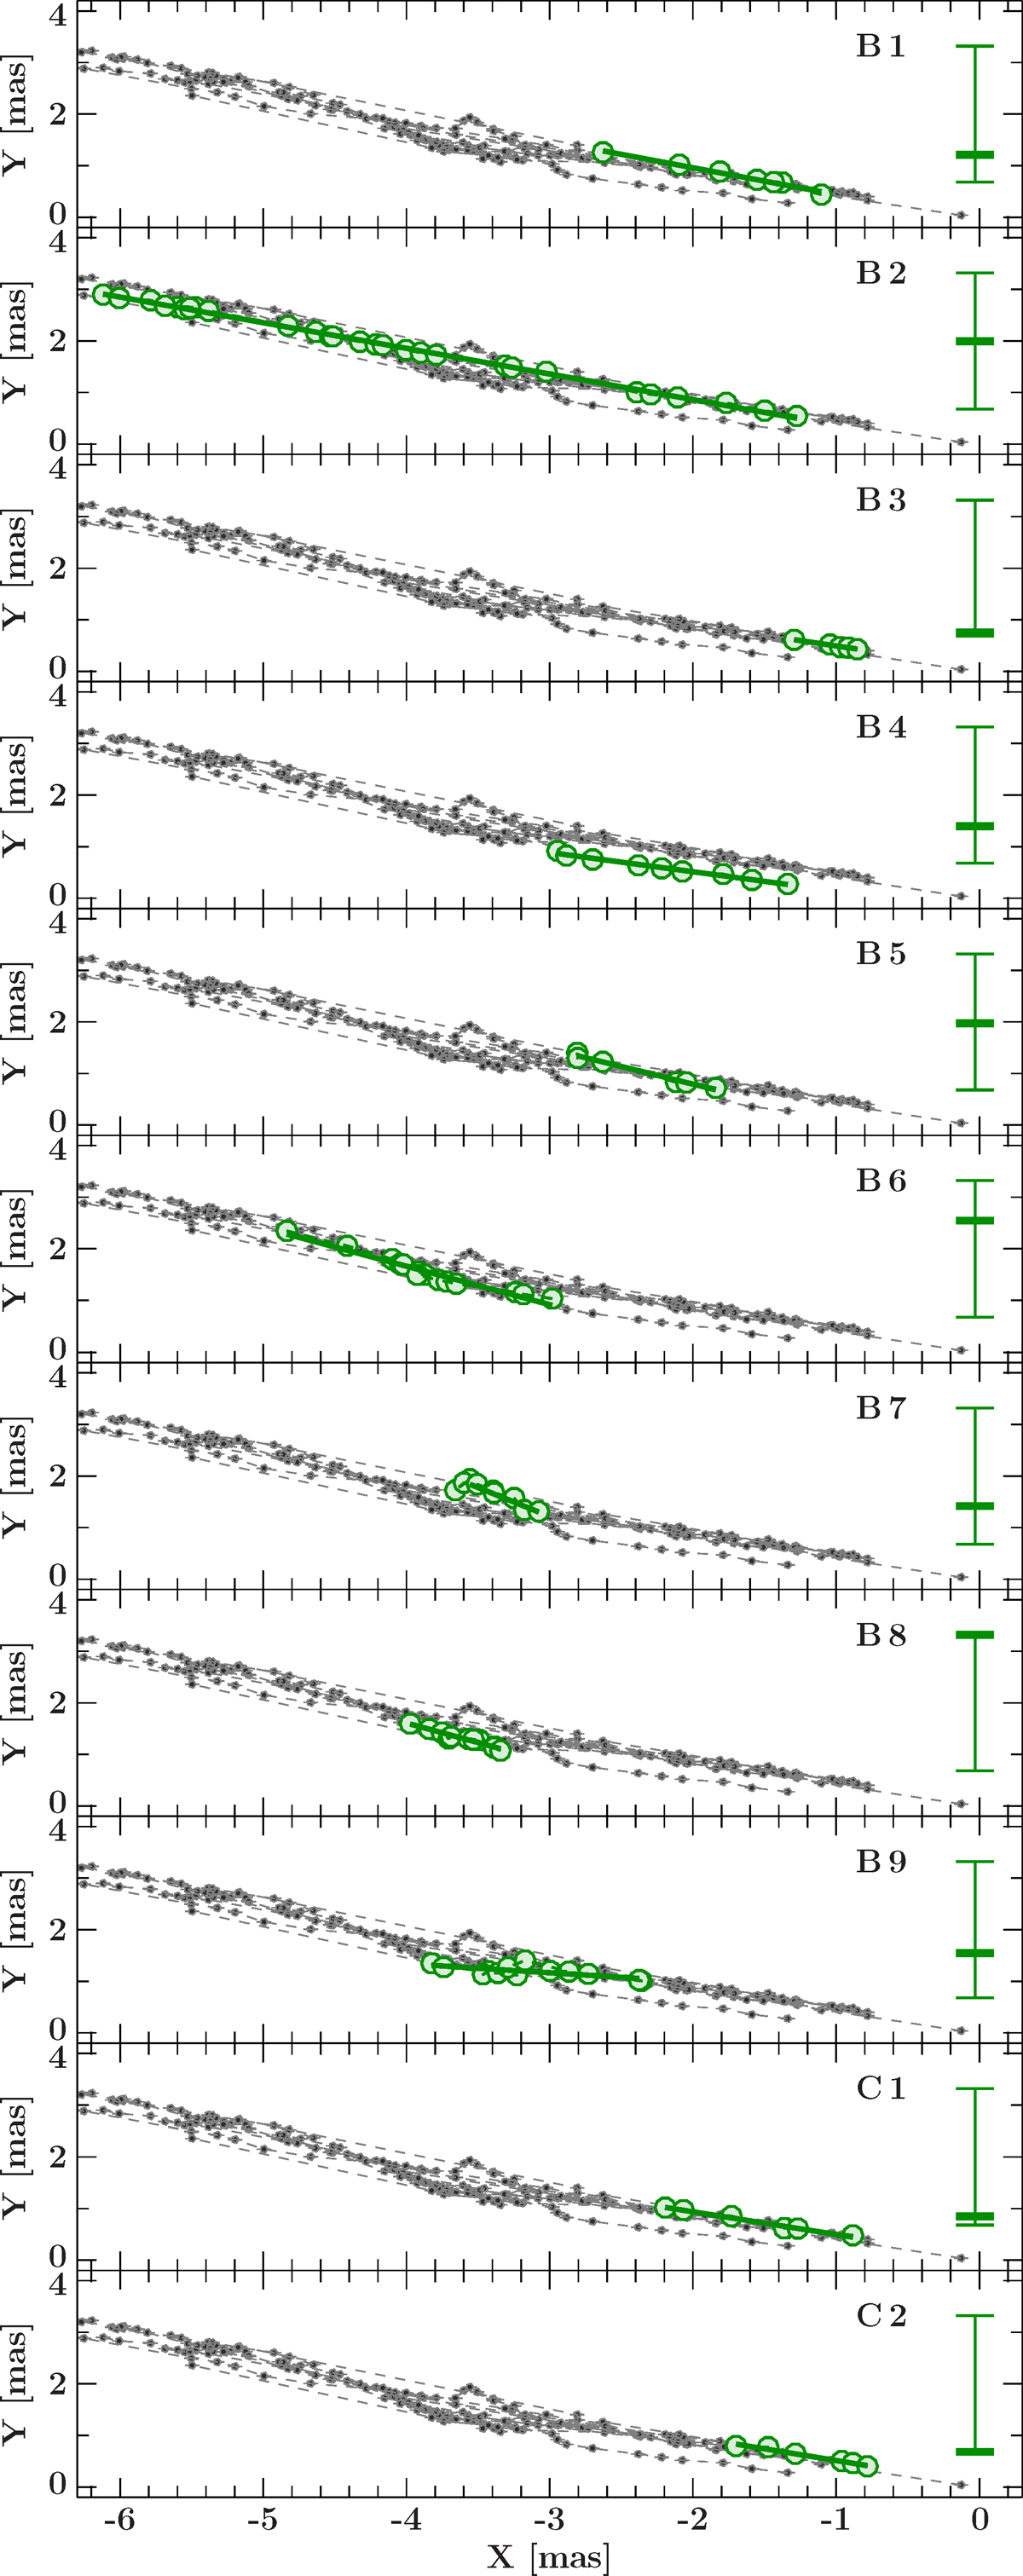
Model component positions in x/y-space for the feature B. In each panel, all model components are shown as gray circles in the background. The colored bar on the right of each panel denotes the average polarized flux of each component within the minimum/maximum fluxes of all components of the feature B, that is, 4.6/17.8 mJy.
Current usage metrics show cumulative count of Article Views (full-text article views including HTML views, PDF and ePub downloads, according to the available data) and Abstracts Views on Vision4Press platform.
Data correspond to usage on the plateform after 2015. The current usage metrics is available 48-96 hours after online publication and is updated daily on week days.
Initial download of the metrics may take a while.