Fig. 13
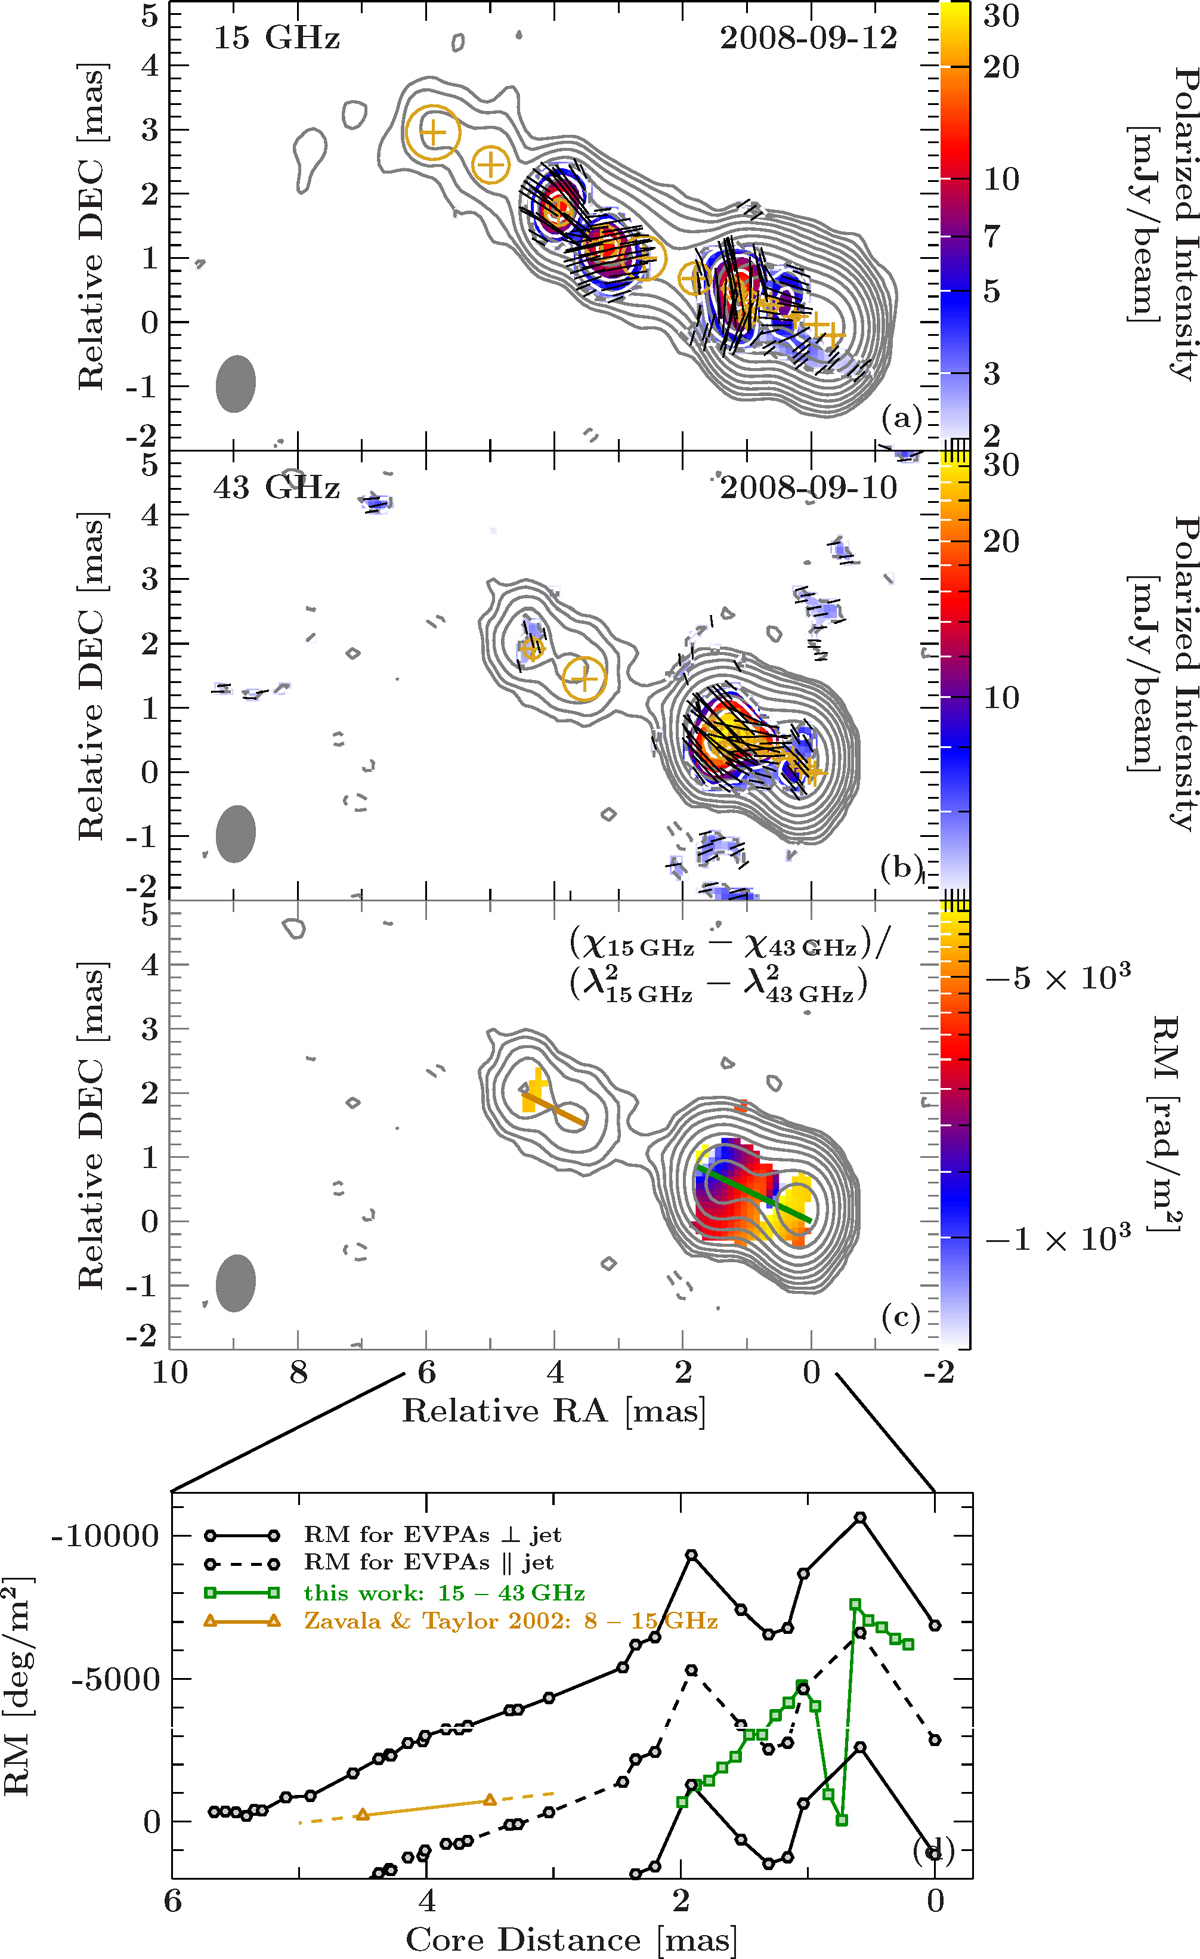
RMmap (panel c) between two adjacent maps at 15 GHz/MOJAVE (panel a) and 43 GHz/BG (panel b) that have also been used to calculate the spectral index in Fig. 12. The polarized emission is overlaid in color on top of the total intensity contours, both at a baseline intensity of 3σ. We only calculate values of RM where we detect polarized emission >3σ both at 15 GHz and 43 GHz. We apply the same relative core shift between the maps at both frequencies as estimated for Fig. 12 and the identical envelope beam. Panel d shows RM cuts along the indicated ridge lines for our measurement upstream of 2 mas (green squares) and for a measurement by Zavala & Taylor (2002) between 3.5 mas and 4.5 mas (orange triangles). We also show as black solid and dashed lines the RM distribution along the jet that is required to explain the observed EVPA evolution of feature B (Fig. 5) with respect to either an intrinsically perpendicular or parallel field, respectively. The two RM distributions shown for an intrinsically perpendicular field reflect the ambiguity of π.
Current usage metrics show cumulative count of Article Views (full-text article views including HTML views, PDF and ePub downloads, according to the available data) and Abstracts Views on Vision4Press platform.
Data correspond to usage on the plateform after 2015. The current usage metrics is available 48-96 hours after online publication and is updated daily on week days.
Initial download of the metrics may take a while.