Fig. 11
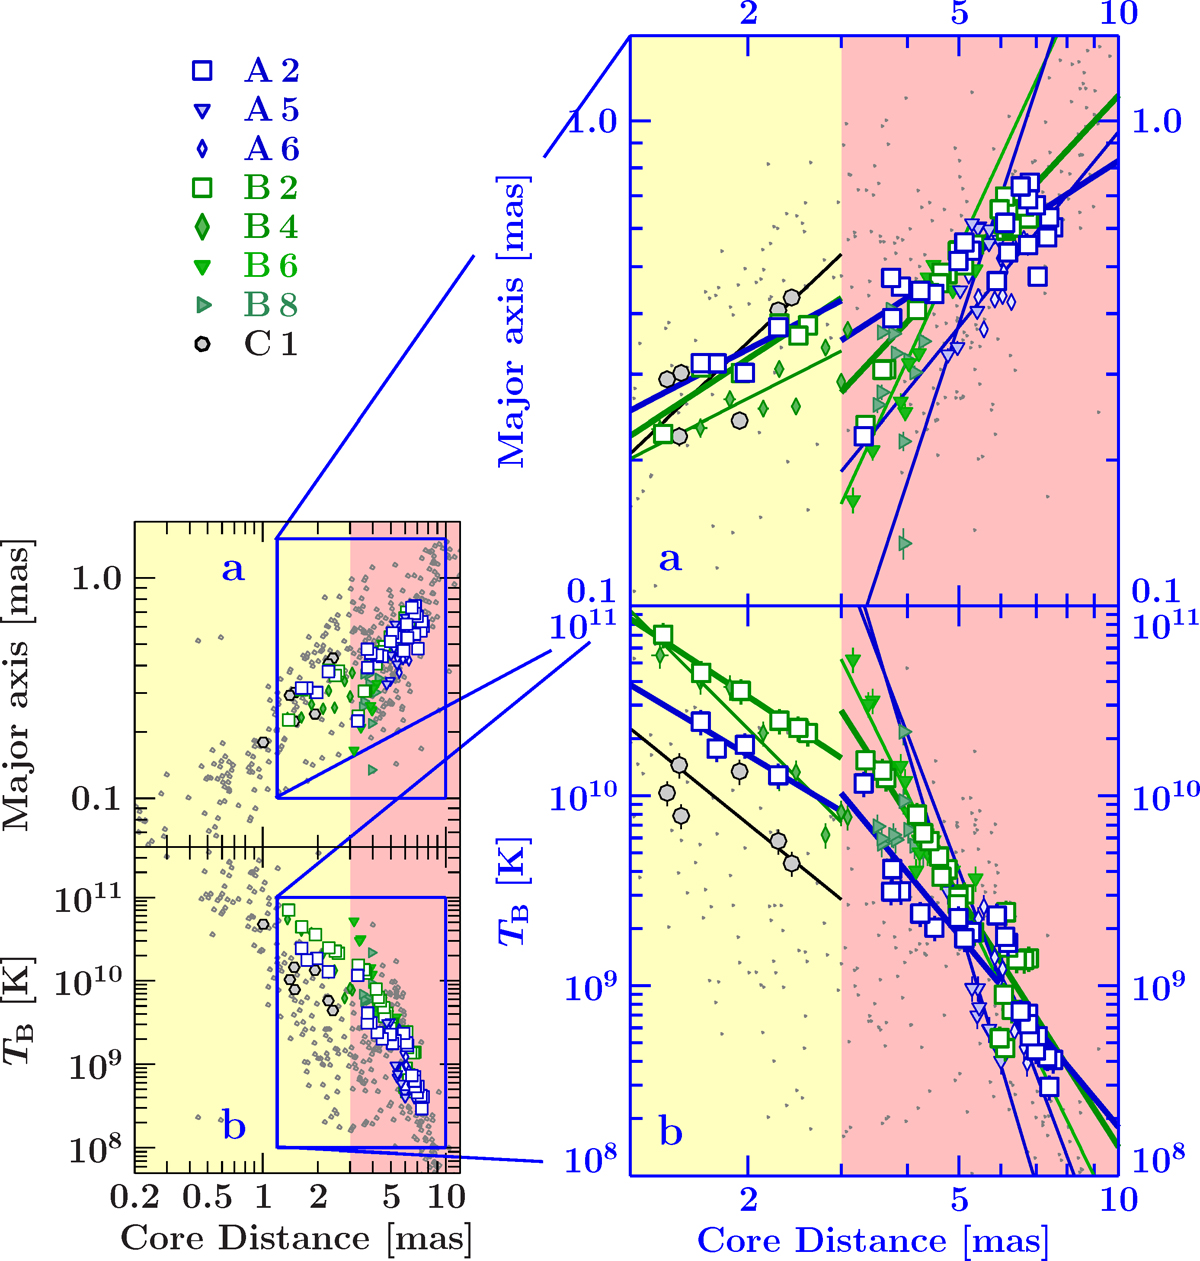
Brightness temperature and major axis size against the core distance for all model components of all epochs (gray). The colored symbols correspond to model components that can be associated with the polarized features A and B. The components A 2 and B 2 probe the transition region at around 3 mas and are therefore emphasized with enlarged squares of white filling. Lines correspond to linear regression fits of data up- and downstream of 3 mas.
Current usage metrics show cumulative count of Article Views (full-text article views including HTML views, PDF and ePub downloads, according to the available data) and Abstracts Views on Vision4Press platform.
Data correspond to usage on the plateform after 2015. The current usage metrics is available 48-96 hours after online publication and is updated daily on week days.
Initial download of the metrics may take a while.