Fig. 4
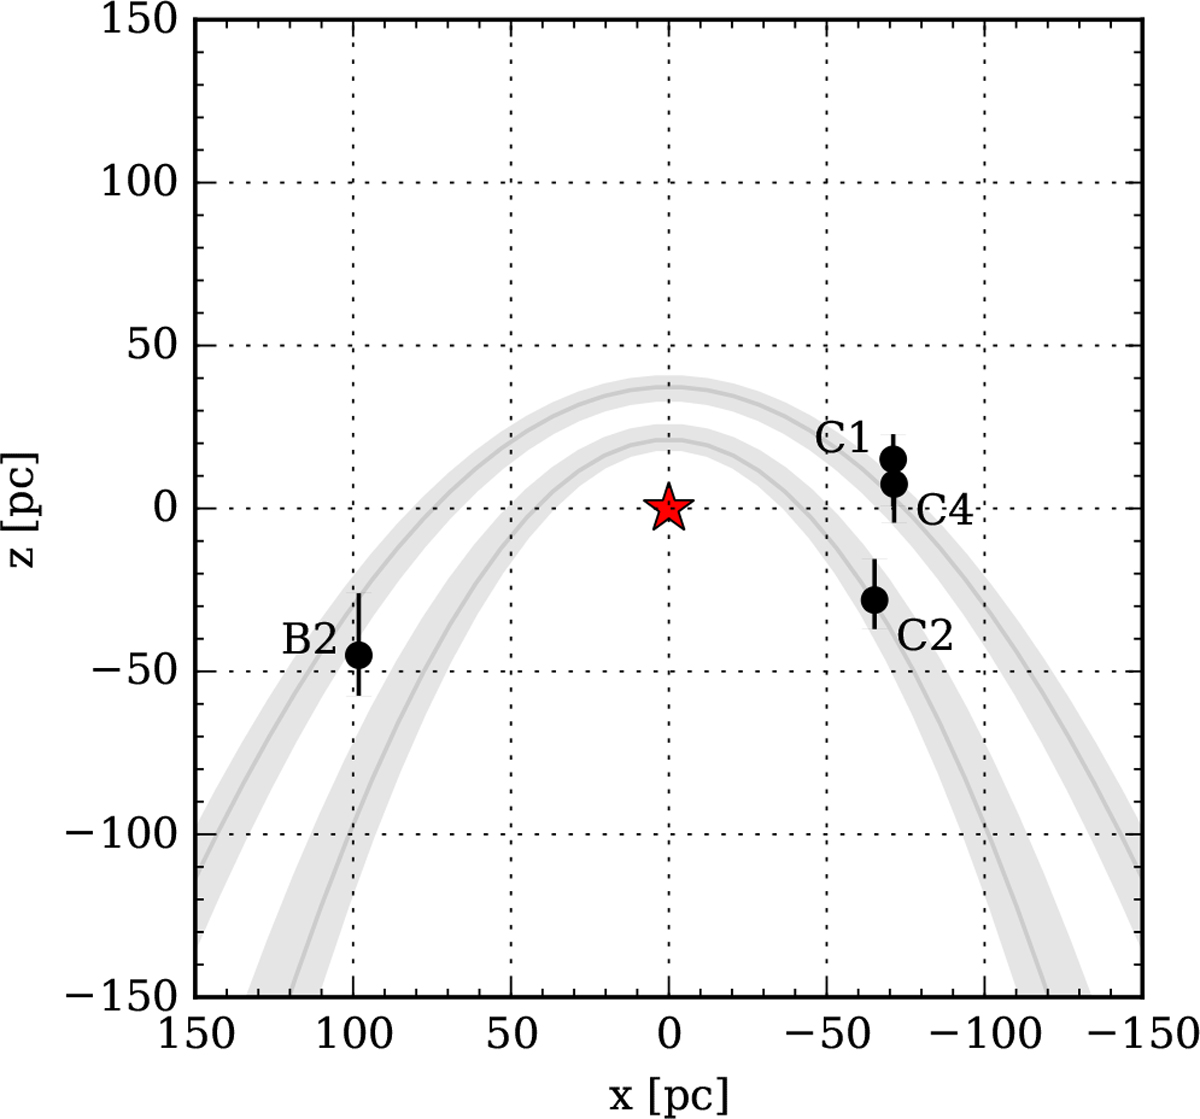
Face-on view of the Galactic centre. The negative direction along the z-axis points towards Earth. The red star marks the position of Sgr A⋆. The black dots show the best-fit positions for the bright clumps Sgr C1, C2, C4 (Table 3), and Sgr B2 (Walls et al. 2016) in the solar-metallicity and uniform density profile case. The grey parabolas trace the best-fit associated wavefronts (as seen from Earth; Sunyaev & Chuarzov 1998) for the two-event model. The width of the parabolas represents the statistical uncertainty on the position, not the duration of the associated event.
Current usage metrics show cumulative count of Article Views (full-text article views including HTML views, PDF and ePub downloads, according to the available data) and Abstracts Views on Vision4Press platform.
Data correspond to usage on the plateform after 2015. The current usage metrics is available 48-96 hours after online publication and is updated daily on week days.
Initial download of the metrics may take a while.