Fig. 2
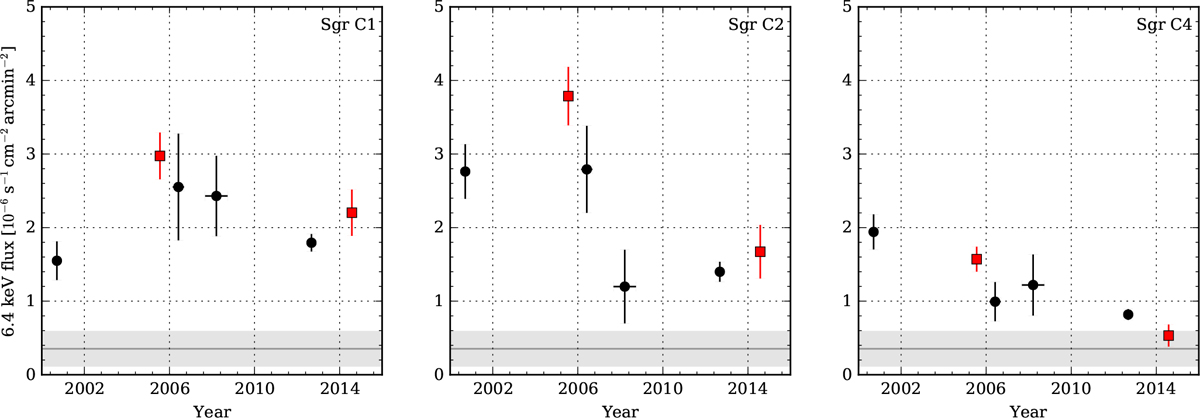
Light curves of the 6.4 keV line emission obtained by fitting the phenomenological model and integrated over the regions Sgr C1 (left), Sgr C2 (centre) and Sgr C4 (right). The black circles and the red squares correspond to XMM-Newton and Chandra observations, respectively. The grey shaded bars show the average level of background emission measured in the control region (their thickness represents one standard deviation).
Current usage metrics show cumulative count of Article Views (full-text article views including HTML views, PDF and ePub downloads, according to the available data) and Abstracts Views on Vision4Press platform.
Data correspond to usage on the plateform after 2015. The current usage metrics is available 48-96 hours after online publication and is updated daily on week days.
Initial download of the metrics may take a while.