Fig. B.2
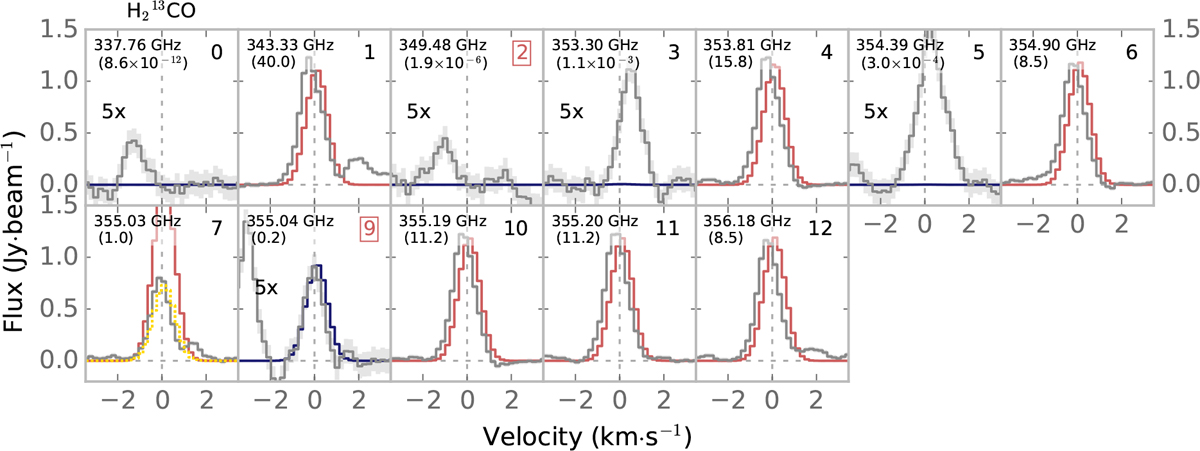
All lines of H213CO with the best fit LTE model overplotted. Synthetic spectra in red indicate optical depth beginning to play a significant role i.e., τ > 0.6. Numbers in top right corner with red boxes indicate lines used to fit the column density. The number in parenthesis is the estimated optical depth. The line in panels 9 and 11, at 355.04 and 355.20 GHz could be blended with significantly weaker H2C17O lines (see panels 5 and 8 in Fig. B.1).
Current usage metrics show cumulative count of Article Views (full-text article views including HTML views, PDF and ePub downloads, according to the available data) and Abstracts Views on Vision4Press platform.
Data correspond to usage on the plateform after 2015. The current usage metrics is available 48-96 hours after online publication and is updated daily on week days.
Initial download of the metrics may take a while.