Fig. 2
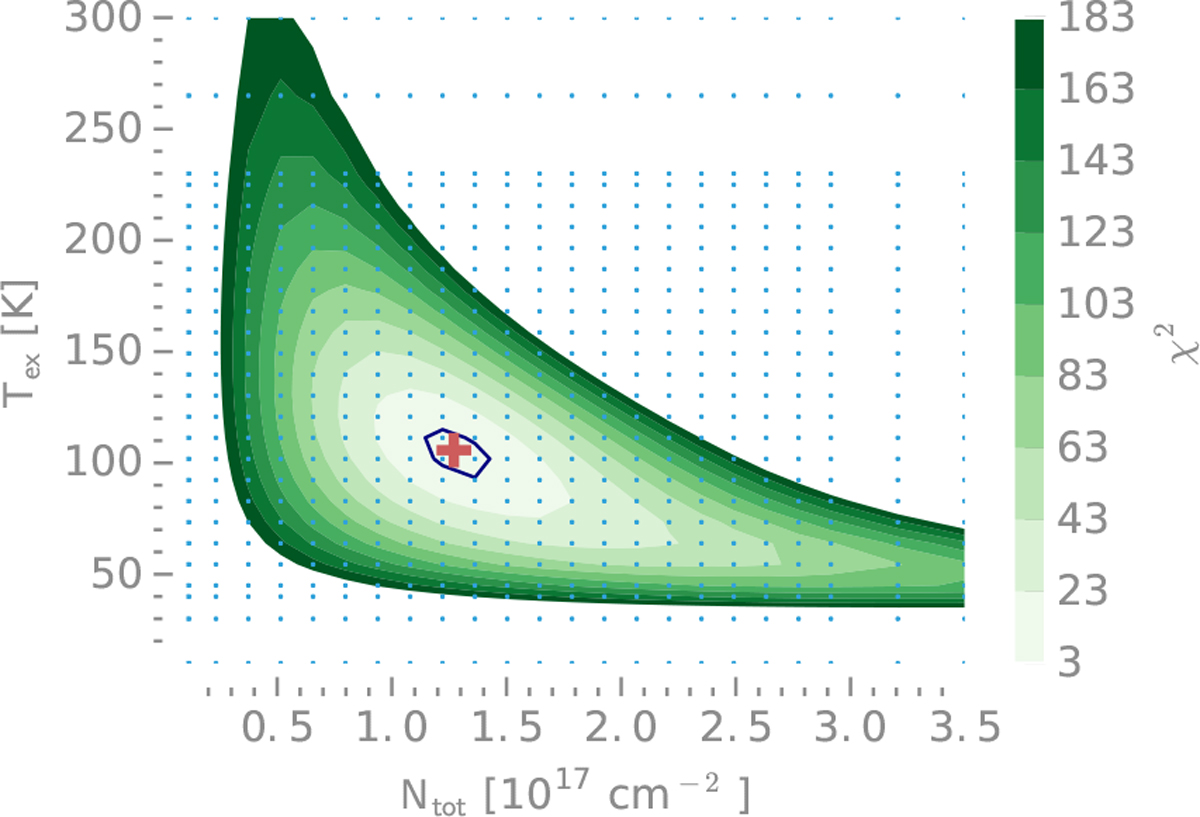
Grid constraining the excitation temperature and column density of HDCO. The cross marks the best fit values, 1.3 ± 0.2 × 1017 cm−2 and 106 ± 13 K from interpolation of the values within the marked area. The contour line marks the Δχ2 = 2.3 region. We note that the column density value has been corrected for the continuum. The dots show the evaluated column densities and excitation temperatures.
Current usage metrics show cumulative count of Article Views (full-text article views including HTML views, PDF and ePub downloads, according to the available data) and Abstracts Views on Vision4Press platform.
Data correspond to usage on the plateform after 2015. The current usage metrics is available 48-96 hours after online publication and is updated daily on week days.
Initial download of the metrics may take a while.