Fig. 1
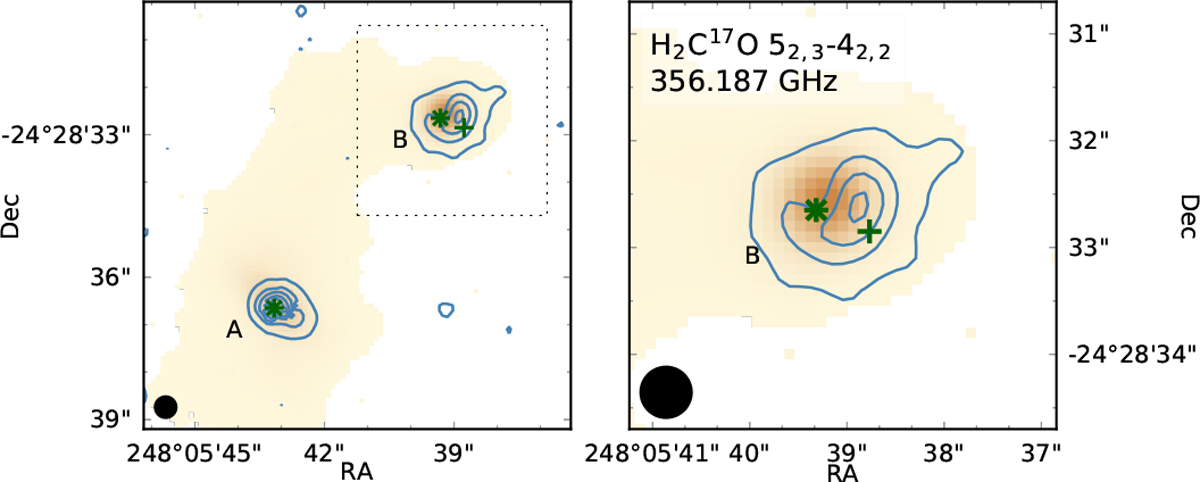
PILS ALMA continuum map of the IRAS 16293−2422 system at 850 μm. The background image shows the continuum emission, the contours indicate the H2C17O 52,3 –42,2 line (Eu = 98.5 K) integrated emission, the star is the position of the continuum peak, and the plus sign the position of the extracted spectrum (one beam, i.e., 0.′′5, away from the continuum). The continuum image is cut off at 15 mJy (3σ) and the line contours start at 25 mJy km s−1 (5σ) in steps of 120 mJy km s−1.
Current usage metrics show cumulative count of Article Views (full-text article views including HTML views, PDF and ePub downloads, according to the available data) and Abstracts Views on Vision4Press platform.
Data correspond to usage on the plateform after 2015. The current usage metrics is available 48-96 hours after online publication and is updated daily on week days.
Initial download of the metrics may take a while.