Fig. 6
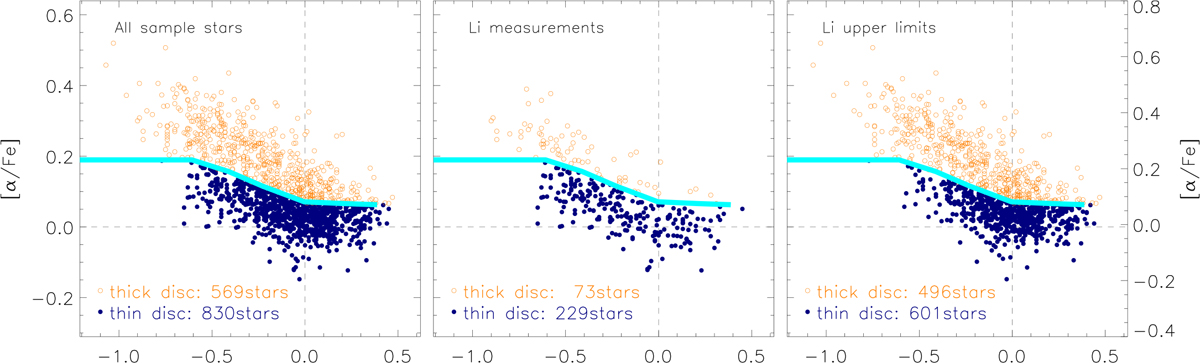
Tentative separation between thick and thin discs in the [α/Fe] –[Fe/H] plane for allsample stars (left panel), stars with Li measurements (central panel), and stars with Li upper limits (right panel). In all panels the vertical and horizontal dashed lines indicate solar values. Filled blue dots represent the Galactic thin disc stars while open orange circles are the thick disc objects. The cyan line shows the division proposed by (Adibekyan et al. 2012).
Current usage metrics show cumulative count of Article Views (full-text article views including HTML views, PDF and ePub downloads, according to the available data) and Abstracts Views on Vision4Press platform.
Data correspond to usage on the plateform after 2015. The current usage metrics is available 48-96 hours after online publication and is updated daily on week days.
Initial download of the metrics may take a while.