Fig. 13
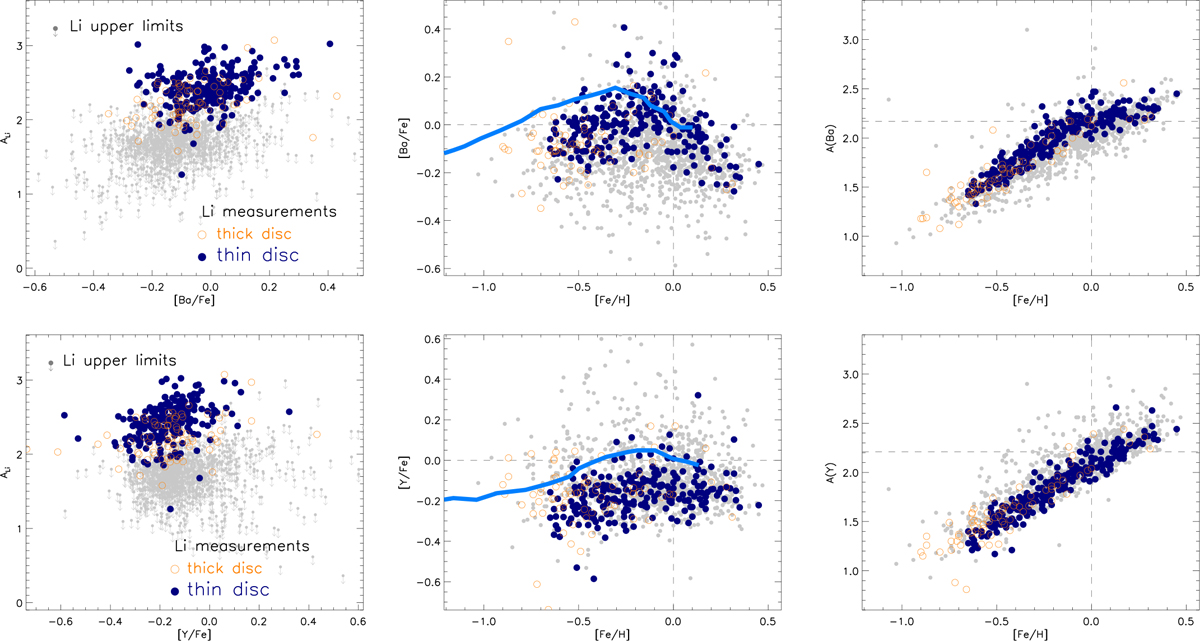
NLTE Li abundance vs. [Ba/Fe] (upper left panel), [Ba/Fe] against [Fe/H] (upper middle panel), and absolute barium abundance A(Ba) as a function of [Fe/H] (upper right panel). The three lower panels are the same for yttrium. The [Ba/Fe] and [Y/Fe] vs. [Fe/H] trends predicted by Bisterzo et al. (2017) for the Galactic thin disc are overlaid with light blue solid lines. Dashed lines indicate the solar values. Stars with Li measurements are separated as thick (filled blue dots) and thin (open orange circles) disc stars, as the same as in the middle panel of Fig. 6. The grey dots represent sample stars with Li upper limits.
Current usage metrics show cumulative count of Article Views (full-text article views including HTML views, PDF and ePub downloads, according to the available data) and Abstracts Views on Vision4Press platform.
Data correspond to usage on the plateform after 2015. The current usage metrics is available 48-96 hours after online publication and is updated daily on week days.
Initial download of the metrics may take a while.