Fig. 12
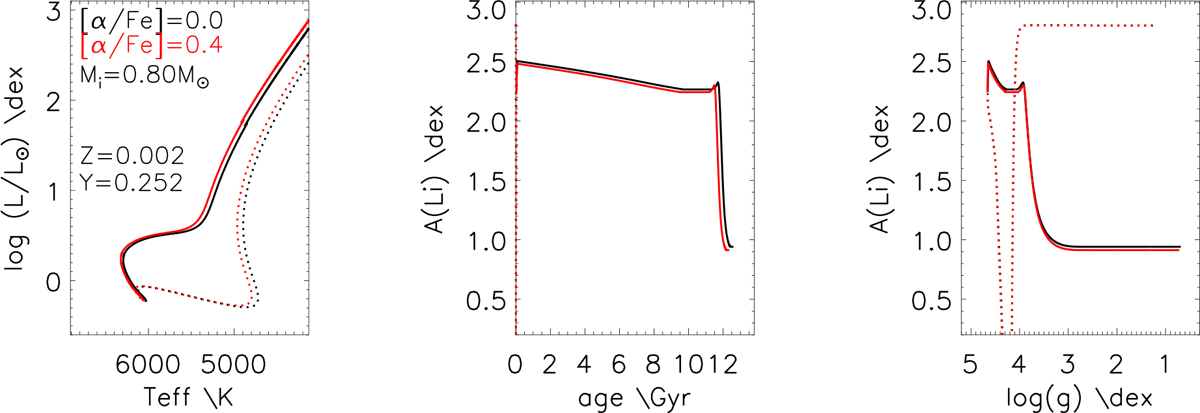
Li evolution from the stellar evolution model PARSEC. Two stars with the same metallicity and He content (Z = 0.002, Y = 0.252), the same initial Li abundance (ALi = 2.8 dex), the stellar mass (Mi = 0.80 M⊙), but different α-enhancements are compared. The red curves indicate the star with [α/Fe] = 0.4 dex while the black ones are for the star with [α/Fe] = 0 (solar-scaled). The dotted lines in both colours represent the evolution before the zero-age main sequence (ZAMS), and the solid lines indicate the evolution after. The panels from left to right are HR diagram, ALi evolution with stellar age, and ALi as a functionof log(g).
Current usage metrics show cumulative count of Article Views (full-text article views including HTML views, PDF and ePub downloads, according to the available data) and Abstracts Views on Vision4Press platform.
Data correspond to usage on the plateform after 2015. The current usage metrics is available 48-96 hours after online publication and is updated daily on week days.
Initial download of the metrics may take a while.